Current Issue

2024 Vol. 42, No. 6

Display Method:
2024, 42(6): .
Abstract(55) HTML (21) PDF(9)
Abstract:
International Research Progress on Highway Tunnel Traffic Safety Based on Bibliometric Analysis
HAN Lei, DU Zhigang, PAN Yuanxuan, QIAN Zhihao
2024, 42(6): 1-13. doi: 10.3963/j.jssn.1674-4861.2024.06.001
Abstract(143) HTML (42) PDF(51)
Abstract:
In order to systematically analyze and comprehensively summarize the current state of research and development trends of highway tunnel traffic safety, relevant English languageliterature published between 2000 and 2022 in this field is retrieved from the Web of Science Core Collection database. Using VOSviewer software, the literature is visually presented and analyzed to create a knowledge map of major research themes and hotspots in highway tunnel traffic safety. The research status, challenges, and development trends in this field are summarized. The results indicate that the annual publication volume of research literature on traffic safety in highway tunnels shows an overall upward trend. In terms of contributions, China leads among countries, Tongji University among institutions, and "Tunnelling and Underground Space Technology" among journals. Current research hotspots in highway tunnel traffic safety focus on topics such as the analysis ofaccident characteristics in highway tunnels, driving environment and driving performance in highway tunnels, highway tunnel lighting and its impact on driving safety, and traffic facilities in highway tunnels and their relving in highway tunnels, levation to driving safety. However, there are limitations in the evaluation methods and technical standards for highway tunnel traffic safety. The consideration of factors in the evaluation system is one-sided and inconsistent, the accuracy and validity of data sources and mathematical models still need to be improved, and the application effects of intelligent transportation technologies on highway tunnel traffic safety need further investigation. Future research in this field should prioritize the development of methods and evaluation models to enhance the driving environment in highway tunnels, considering different levels of demand. It should also focus on macro-level situation analysis and micro-level individual analysis of driving in highway tunnels, leveraging multi-source, heterogeneous, and big data. Additionally, research should study driving risk perception models and control strategies for highway tunnels, utilizing machine learning and intelligent connected vehicle technologies.
Research Status and Hotspot Analysis of Dangerous Goods Transportation by Waterway in China
ZHANG Di, LIU An, LIU Yang, TIAN Huibin
2024, 42(6): 14-22. doi: 10.3963/j.jssn.1674-4861.2024.06.002
Abstract(80) HTML (24) PDF(27)
Abstract:
With the continuous expansion of the global economy and the sustained improvement of the industrial level, the demand for energy and chemical products is constantly increasing in various countries, and such chemical products are mostly classified as dangerous goods. Due to its advantages of low transportation cost, large capacity, safety, environmental friendliness, and wide transport range, waterway transportation has become the primary mode for the transport of dangerous goods. In recent years, to enhance the safety and efficiency of waterway transportation of dangerous goods, domestic scholars have conducted a large amount of research. To systematically review the current research status and future development trends in this field in China, this paper retrieved 368 relevant docu-ments published in Chinese core journals from 2015 to 2024. Through statistical analysis of the annual publication volume, journal distribution, research institutions, and key scholars of the retrieved literature, and using VOSviewer software for keyword clustering and evolutionary trend analysis, this paper summarizes the research hotspots into four main aspects: design of dangerous goods ships, management of dangerous goods transportation, transportation risk assessment, and emergency response. Current research has made certain progress in the innovation of ship design, intelligent management of transportation, precise risk assessment, and efficient emergency response, but it still faces challenges such as low intelligence in design and safety management, insufficient comprehensiveness in risk assessment, and lack of targeted emergency response equipment. Future research should focus on the application of artificial intelligence technology in the design and operational safety monitoring of hazardous material ships, as well as promoting the integration of green and low-carbon technologies in ship energy efficiency optimization and power sub-situation, to enhance the safety and sustainability of waterway transportation of dangerous goods.
A Recognition Method for Risky Driving Behaviors of Urban Expressway Merging Area Based on DE-EL Model
XIE Ting, LIU Xingliang, LIU Tangzhi, XU Jin
2024, 42(6): 23-30. doi: 10.3963/j.jssn.1674-4861.2024.06.003
Abstract(107) HTML (36) PDF(29)
Abstract:
A method for recognizing risky driving behaviors using vehicle trajectory data is established to improve safety and prevent traffic accident in urban expressway merging areas. The characteristic thresholds of four types of risky driving behaviors are firstly determined using a risk assessment approach and the interquartile range method. Subsequently, drivers'risk scores (G) are calculated using the established spectrum of risky driving behaviors, enabling the classification of drivers as safe or risky. To balance the datasets, the driving risk samples are augmented by data equalization (DE) algorithms (ROS, ADASYN, and SMOTE). Combining ensemble learning (EL) algorithms (XGBoost, LGBM and AdaBoost) to build various DE-EL models for risky driving behaviors recognition. The Spearman correlation coefficient is used to optimize the input feature parameters, which include five categories: vehicle speed, acceleration and deceleration, lateral operation, position characteristics and time occupation ratio. The optimal recognition model is is determined based on precision rate, recall rate, F1 -score and AUC value. The results show that the level of driver risk is most strongly correlated with driver lateral operation and less so with vehicle speed in merging areas. The unbalanced trajectory dataset makes it difficult to effectively identify risky driving behaviors by the EL algorithm, while the DE algorithm can improve the properties of the classification algorithm. After optimizing the input feature parameters, the performance of the DE-EL recognition model improves, and the SMOTE-LGBM model is the best one with precision rate of 93.4%, recall rate of 92.1%, F1 -score of 0.927, and AUC value of 0.933. This model is applicable for recognizing, warning, intervening in risky driving behaviors in merging areas.
A Risk Assessment Method for Civil Aviation Passengers Based on The Fusion of Multi-risk Factors
YANG Jun, LIU Haoran, WU Renbiao, WANG Feiyin
2024, 42(6): 31-41. doi: 10.3963/j.jssn.1674-4861.2024.06.004
Abstract(107) HTML (32) PDF(16)
Abstract:
Civil aviation passengers are the main implementers of civil aviation security measures. Therefore, in order to accurately assess the risk level of civil aviation passengers, a civil aviation passenger risk assessment method based on the fusion of multi-risk factors is proposed. The risk factors associated with passengers are identified through statistical analysis, regulation and expert investigation. According to the characteristics, the risk factors associated with passengers are categorized into three main parts: possibility, hazard and severity. Combined with the control measures, a risk index system for civil aviation passengers based on multi-risk factors is constructed, which contains 7 first-level indicators and 18 second-level indicators. The interval analytic hierarchy process can fully account for the uncertainty and fuzziness of expert judgments, while the set value statistics method allows for the quantitative representation of fuzzy indicators. By combining the advantages of these two methods, a quantitative analysis method based on the combination of internal analytic hierarchy process and set value statistics method are applied to calculate the weight coefficients of the risk indicators. To meet practical application requirements, passenger security data are collected throughout the passenger journey. And a risk assessment method for civil aviation passengers, based on the fusion of multi-risk factors, is proposed to enable dynamic quantitative risk assessments throughout the entire process. The proposed method is validated using a constructed validation dataset. The experimental results show that the recall rate for high-risk passengers reached 92%, with no high-risk passengers being assessed as low risk. The recall rate for medium-risk passengers reached 96%, with only 2% of medium-risk passengers assessed as low risk. The recall rate for low-risk passengers also reached 96%, with no low-risk passengers assessed as high risk. The proposed method enables a dynamic quantification assessment of civil aviation passenger risks, effectively integrating expert knowledge and indicator characteristics. This provides a theoretical foundation for a more comprehensive, rational, and scientifically-driven analysis of risks associated with civil aviation passengers.
The Development of Low Altitude Airspace Safety Management Driven by New Quality Productivity: A Low Altitude Airspace Safety Management System (LASMS)Conceptual Framework of Urban Air Mobility
YU Shasha, CHEN Yijun, ZHANG Xuejun, CHEN Xingyu
2024, 42(6): 42-54. doi: 10.3963/j.jssn.1674-4861.2024.06.005
Abstract(148) HTML (31) PDF(37)
Abstract:
Safety is the prerequisite and baseline for the development of the low-altitude economy, and the challeng-es of safety supervision in future low-altitude airspace operations are receiving increasing attention. Addressing the difficulties faced in urban low-altitude airspace safety management, such as high airspace complexity, a wide vari-ety of aircraft types, high airspace usage density, numerous cybersecurity and data privacy risks, complex system in-tegration and interoperability, and substantial differences in laws, regulations, and standards. This paper considers the evolving trend in aviation safety management systems (SMS), which is shifting from single to diversified super-visory targets and from post-event management to real-time management. It proposes a conceptual framework for an urban low-altitude safety management system (LASMS), encompassing operational roles and structures for low-altitude airspace, safety performance indicators for urban air mobility (UAM), identification of low-altitude risk sources, risk monitoring, risk assessment, and risk mitigation. The core of LASMS is safety risk manage-ment, which emphasizes the identification, monitoring, assessment, and mitigation of risks to achieve near-real-time safety supervision of low-altitude aircraft throughout pre-flight, in-flight, and post-flight phases.In terms of manage-ment approaches and operational models, LASMS integrates multi-domain collaboration, distributed architec-tures, digital monitoring, and mitigation mechanisms to meet the rapid response requirements of future low-altitude operations. It enhances autonomy and automation, strengthens proactive safety control before and after flights, and ensures near-real-time safety management during flights. The discussion highlights key directions for the develop-ment of LASMS, driven by New Quality Productivity through technological innovation, alongside advancements in aviation safety management and operational models. The introduction of LASMS offers new perspectives and meth-odologies for low-altitude safety regulation, supporting the safe, efficient, and sustainable development of low-alti-tude airspace in the future.
An Evaluation Model for Driver Takeover Performance Based on Multi-objective Indicators Representation
WANG Dan, ZHU Yueying, ZHANG Ce, LIN Ye
2024, 42(6): 55-63. doi: 10.3963/j.jssn.1674-4861.2024.06.006
Abstract(70) HTML (18) PDF(13)
Abstract:
The takeover performance of drivers is of great significance for the safety, driving experience, and acceptance of conditionally automated vehicles. To study the impacts of driver behavior on takeover performance, a comprehensive evaluation representation index, takeover performance level (TOPL), is proposed, and a model based on an improved EWM-TOPSIS method is constructed to evaluate TOPL. The model determines the objective weight of each index using the entropy weight method (EWM), and then codes and maps each index based on the positive and negative ideal solutions in the technique for order preference by similarity to ideal solution (TOPSIS) model, thereby constructing the TOPL evaluation model. To verify the effectiveness of the model, 46 drivers participated in a human-machine co-driving takeover experiment, from which multidimensional evaluation indicators representing the safety, comfort, and smoothness of driver takeover performance are extracted. The study examines non-driving-related tasks by drivers during takeover and the impacts of the lead time for takeover requests on the level of driver takeover performance. Furthermore, the study analyzed the significant impacts of driver age and standard non-driving-related task performance on TOPL. The results show that both driver age and non-driving-related task performance scores significantly impact TOPL. Additionally, significant differences in driver mileage are observed between the mileage ranges of 50 000 to 100 000 km, 0 to 50 000 km, and 100 000 to 1 000 000 km. A significant negative correlation exists among the maximum yaw rate, maximum lateral acceleration, maximum lateral velocity, throttle depth standard deviation, and TOPL, whereas the time to reach the takeover boundary is significantly positively correlated with TOPL. In relation to varying takeover time budgets and the performance in completing non-driving tasks, TOPL exhibited the minimum takeover time budget of 4 s, and its takeover performance level is observed to be lower under conditions of emergency takeover. Additionally, when the driver's score in non-driving task completion fell below 60, TOPL recorded the highest values, and the TOPL decreases as the score increases.
Reliability of Acceleration Lane Length in Confluence Area of Superhighway
HE Yongming, WANG Fan, WU Jiaxuan, XING Wanyu
2024, 42(6): 64-73. doi: 10.3963/j.jssn.1674-4861.2024.06.007
Abstract(68) HTML (18) PDF(22)
Abstract:
To overcome the shortcomings of the current specifications that use deterministic model to design the acceleration lane length, considering different ramp design speeds, the reasonable length of acceleration lane is investigated to meet the requirements of traffic safety and efficiency. The functional function of the acceleration lane length is established by using the length calculation model based on vehicle merging theory and introducing the reliability theory. Statistical inference is conducted on related parameters such as the minimum merging speed in the functional function. Random variables are generated and substituted into the Monte Carlo method for solving, to estimate the reliable probability of the acceleration lane length under different mainline and ramp design speeds. Combined with the standard for reliability design standard of structure and the reliability probability greater than 95%, the recommended values of the superhighway acceleration lane length corresponding to the main line design speed of 140 km/h and the ramp design speed of 30, 40, 50, 60 km/h are obtained. The rationality of the recommended value is verified by Simulation of Urban Mobility (SUMO), and the results show that the reliability probability of the acceleration lane increases as the acceleration lane length increases, and tends to be stable after reaching a certain value. The acceleration lane length is affected by the mainline design speed and the ramp design speed, and is negatively correlated with the ramp design speed under a given service level and target reliability index. Compared with the deterministic model, the design of acceleration lane length through reliability theory and traffic simulation model is more flexible and reliable.
A Recognition Method for Ship Motion Pattern Based on Nine-axis IMU
CHEN Qianqian, HU Fengling, WEN Yuanqiao
2024, 42(6): 74-83. doi: 10.3963/j.jssn.1674-4861.2024.06.008
Abstract(37) HTML (9) PDF(10)
Abstract:
Motion pattern recognition is an important issue for achieving intelligent navigation of ships. To address the limitations of existing methods, including slow data update rates and strong environmental constraints, a ship motion pattern recognition method based on nine-axisinertial measurement unit (IMU) is proposed. The shortcomings of current ship motion sensing technologies are analyzed, and a nine-axis IMU consisting of an accelerometer, gyroscope, and magnetometer is utilized to identify ship motion parameters. To process long-duration continuous signals encompassing multiple motion patterns, a data segmentation algorithm based on hidden Markov model is developed. The expectation maximization algorithm is employed to estimate model parameters, enabling signal segmentation according to motion patterns and the extraction of single steady-state motion signals. The time-domain features that characterize ship motion patterns are then extracted from the segmented signals. To improve recognition accuracy, a support vector machine (SVM) algorithm based on a binomial tree structure is designed. The binary tree structure is constructed using the maximum cut problem, with SVM classifiers employed at decision nodes. The particle swarm algorithm is applied to optimize the model parameters. Experiments conducted using ship motion data collected from real ships validate the proposed method. Results show that the proposed recognition algorithm requires training only five SVM sub-classifiers for the recognition of six ship motion patterns, achieving an average recognition accuracy of 96.498%. Compared to traditional one-to-one and one-to-rest SVM multi-classification methods, the proposed method improves average recognition accuracy by 13.835% and 21.305%, respectively, while requiring fewer sub-classifiers for training. These findings demonstrate the superiority and efficiency of the proposed approach.
A Detection Method of Traffic Scene License Plate for Data Desensitization
YING Shen, ZENG Zhuoyuan, ZHANG Jiyuan
2024, 42(6): 84-94. doi: 10.3963/j.jssn.1674-4861.2024.06.009
Abstract(51) HTML (12) PDF(4)
Abstract:
Rapid and accurate detection of license plates in vehicle-based images is significant for protecting privacy information in smart transportation. However, the original YOLOv8 algorithm has limitations on the license plate detection in traffic scenes, such as weak feature extraction ability of small targets and misdetection of background information, etc. To fill these gaps, an improved traffic scene license plate detection method based on YOLOv8 (TLP-YOLO) is proposed. The efficient multi-scale attention (EMA) module is adopted to enhance the ability of the backbone network to extract image characteristics. It makes the backbone network pay more attention to target regions of different scales and improves the recognition ability of the model to background information. A new feature pyramid network with skip connection and weighted fusion (SW-FPN) is designed. It enriches the features of small targets and avoid the information loss between different levels of the feature pyramid network, which improving the multi-scale feature fusion ability. In order to reduce the floating-point operations (FLOPs) and maintain the detection accuracy, the partial convolution (PConv) and pointwise convolution (PWConv) modules are introduced to replace the conventional convolution structure in detection head, which reduces redundant calculations and improves the utilization efficiency of spatial features. Based on Chinese city parking dataset (CCPD) and Chinese road plate dataset (CRPD), a dataset with multiple traffic scenes is constructed to verify the property of the model. Experimental results show that: ①The average precision (IOU changes from 0.5 to 0.95) of the proposed network is 83.6%, which is 2% higher than that of YOLOv8. The average precision (IOU is 0.7) of the proposed network is 97.7%, which is 0.8% higher than that of YOLOv8. ②The FLOPs of TLP-YOLO model is 7.5 G, the number of parameters is 1.67 M, and the detection speed reaches 101 fps. In comparison to the original YOLOv8, the FLOPs and the number of parameters is reduced by 8% and 45%, the detection speed is about the same. The improved algorithm can not only ensure the lightweight of the model, but also meet the requirements of vehicle equipment for the accuracy and deployment of license plate detection in traffic scenes.
A Recognition Model for Passenger Boarding and Alighting Action Based on Improved Temporal Pyramid Network
LIAO Huimin, LUO Jingming, ZHANG Jinghui, LIU Wenping, DONG Wanqing, XIAO Hui, HUANG Jian
2024, 42(6): 95-102. doi: 10.3963/j.jssn.1674-4861.2024.06.010
Abstract(82) HTML (24) PDF(10)
Abstract:
Traditional algorithms for identifying illegal passenger-carrying behavior, which rely on image processing techniques, utilize manually crafted human-vehicle interaction rules to discern boarding and alighting actions. However, these rule sets often fall short due to the intricate nature of traffic scenarios, resulting in suboptimal recognition performance. Therefore, a deep learning model based on a temporal pyramid network(TPN) is introduced for boarding and alighting action recognition. By training on a large dataset, more complete features of taxi passenger boarding and alighting behaviors are extracted to improve recognition accuracy. To address the issue of the TPN model not distinguishing between driver and passenger roles, the output layer is redesigned based on door area perception. This modification enhances the efficiency of multi-dimensional feature extraction. To tackle the issue of the large spatiotemporal span in boarding and alighting actions, which leads to interference from irrelevant movements, a sliding window mechanism is introduced. This mechanism, based on dynamic window weights, captures key video frames of the actions, enhancing recognition efficiency. Based on the above improvement measures, a boarding and alighting neural network(BANN) model, based on door area perception and dynamic weights, is proposed to efficiently and accurately recognize illegal passenger-carrying behaviors. A training dataset with 4, 047 annotated video clips and a test dataset with 810 unannotated video clips are constructed for model performance validation based on surveillance videos from Beijing Capital Airport. Experimental results demonstrate that the BANN model achieves precision and recall rates of 90.21% and 88.53%, respectively, representing improvements of 9.78% and 11.04% over the baseline TPN model. These results indicate that the BANN model can effectively meet the needs of traffic order supervision in transportation hubs.
Trajectory Optimization for Connected Automated Vehicles Borrowing Urban Dedicated Bus Lane
FU Fengjie, LI Bolin, JIN Sheng
2024, 42(6): 103-111. doi: 10.3963/j.jssn.1674-4861.2024.06.011
Abstract(43) HTML (18) PDF(8)
Abstract:
Connected and automated vehicles (CAV) can reduce the mutual interference with human driving vehicles (HDV), thereby enhancing the utilization efficiency of bus lanes, which is one of the important ways to improve the operation efficiency of CAV in the current mixed traffic flow environment. The trajectory optimization model of CAV utilizing bus lanes is proposed, taking into account the constraints of bus lane trajectory, the physical characteristics of the bus lane, and the traffic signal timing scheme. This model incorporates the overtaking behavior of CAVs at harbor bus stops.The model is decomposed into sub-models and meshed in time and space to elucidate the specific process of model solution. The solution method is established based on a greedy algorithm-like algorithm, and the model is solved using MATLAB and yalmip solving tools. To illustrate the efficacy of the proposed model, numerical simulations are conducted for the bus lane on Moganshan Road in Hangzhouas a case study.These simulations analyzed the impact of various factors, including harbor-style bus stop, bus stop time, and traffic signal timing parameters on the model results, and further verified the effectiveness of the model. The results show that the bus stop time will significantly affect the CAV travel speed, and with the increase of bus stopping time, the CAV travel speed will increase first and then decrease. The results show that a collaborative optimization of bus stop time and traffic signal timing can enhance the operational efficiency of CAV. Furthermore, the presence of harbor-style bus stops has been found to augment the CAV operation speed by 10% when compared to the absence of such infrastructure.
A Short-term Traffic Flow Prediction Method Based on Time Series Data Decomposition and Reconstruction
BING Qichun, ZHAO Panpan, REN Canzheng, WANG Xueqian, ZHAO Yiming
2024, 42(6): 112-122. doi: 10.3963/j.jssn.1674-4861.2024.06.012
Abstract(66) HTML (19) PDF(12)
Abstract:
In order to extract signal components with rich feature information from short-term traffic flow data and further improve the prediction accuracy, a short-term traffic flow prediction method based on temporal data decomposition reconstruction is constructed by combining the parameter optimization based variational mode decomposition (VMD), recurrence quantification analysis (RQA), and bidirectional gated recurrent unit (BIGRU) models. The osprey cauchy sparrow search algorithm (OCSSA), which integrates the osprey and cauchy variants, is used to determine the number of modal components and the penalty factor of the variational modal decomposition, and to obtain the relatively smooth intrinsic modal components. The decomposed modal components are reconstructed into the deterministic components, fluctuating components, and trend components through the recursive quantitative analysis. Based on this, for each reconstructed component the BIGRU prediction model is constructed, and the predicted values of each reconstructed component are nonlinearly integrated using the BIGRU prediction model to obtain the final prediction results. The measured data of the flow of Shanghai North-South Expressway and California Expressway network are used for validation, The results show that in the NBDX08(1) dataset, the corresponding mean absolute error, root-mean-square error, and mean absolute percentage error are reduced by 29.1%, 24.5%, and 46.1% on average, respectively, compared with the other models; and the errors in the dataset of No. 760101 are reduced by 19.05%, 19.69%, and 16.46% on average. These verify that the proposed method for the decomposition and reconstruction of different components can accurately capture and learn the characteristics of traffic flow components, which further improves the prediction accuracy while controlling the computational complexity of the model.
Effects of the Display Cycle of Variable Message Signs on Driving and Recognition Behavior in Work Zones
KANG Nan, CAI Shiyuan, LUO Wenting, ZHANG Shiyan
2024, 42(6): 123-132. doi: 10.3963/j.jssn.1674-4861.2024.06.013
Abstract(27) HTML (6) PDF(5)
Abstract:
The display cycle is one of the most important characteristics of variable message signs (VMS). However, the design standards of VMS display cycles are not mentioned in the national standard GB 5768: Road Traffic Signs and Markings. In order to provide valuable evidences, a driving simulation experiment considering a single vehicle is conducted under the condition of work zones on urban roads. The graphic and animated loop are designed based on the theme of"construction ahead, please change lanes". Three display cycle scenarios of 1, 2, and 4 s are simulated. The speed, acceleration, lateral position, recognition distance, comprehension time and reaction time of 32 drivers are collected. The effects of the VMS display cycles are evaluated from two aspects: driving behavior and recognition behavior. Through dimensionless processing, the comprehensive evaluation scores for the three display cycles are calculated. Finally, based on these scores the best design of the VMS display cycle among the scenarios is selected. Through the experiment it is found that, comparing the speed in front of the VMS location to the normal sections, the travel speed in the 2 s scenario is reduced most with the reduction of 15.77 %. Additionally, the acceleration in the 2 s scenario also shows the smallest value. Moreover, the lane-changing distance is the shortest in the 2 s scenario. Based on the results, it can be implied that the 2 s scenario not only provide better deceleration performance but also prompting drivers to complete lane-changing behavior quickly to reduce the possibility of conflicts. In terms of recognition, the recognition distance in the 2 s scenario is the farthest with an average value of 313.01 m. Although the fastest comprehension is not achieved in the 2 s scenario, the reaction time in this scenario is the shortest. It is indicated that the 2 s scenario can provide farther recognition distance and guide drivers to react promptly. Through calculating the comprehensive evaluation scores, it is concluded that the 2 s VMS performed best among the three designed display cycles.
A Study on Spatial-temporal Variability and Impact Factors of Economic Distance for Freight Transport in the Yangtze River Economic Belt
ZHONG Ming, LAI Zeqiang, PAN Xiaofeng, HU Jiangong
2024, 42(6): 133-142. doi: 10.3963/j.jssn.1674-4861.2024.06.014
Abstract(36) HTML (10) PDF(15)
Abstract:
To overcome the shortcomings of existing researches on freight economic distances(FED), particularly in the analysis of spatial-temporal variability and the exploration of influencing factors, this study adopted the Yangtze River Economic Belt(YREB) as the research context and studied the spatial-temporal variability and influencing factors of FED. With the existing big data of freight transport and yearly data of freight volumes of highway, railway, and waterway, the volume-share method is used to calculate FED in different regions of the YREB from 2011 to 2020. Meanwhile, the spatial-temporal variability of FED is analyzed. The study finds that: ①Freight transport of railway has no advantages in the YREB in general. ②In upstream provinces, the freight transport of railway does show FED while the range of FED gradually decreases as time goes on. ③In the YREB, the FED of freight transport of highway shows a shrinking trend, while the FED of freight transport of waterway shows an expanding trend with the time goes on. Next, to study the influencing factors of FED, a path analysis model is established. Given that the results show that the fitness of the path analysis model is poor, therefore, the geographically and temporally weighted regression(GTWR) modeling technique is used based on the framework of the path analysis model to analyze the influences of various factors on FED across different years and regions within the YREB. It turns out the model fitness is satisfactory and the final results show that the influences of various factors on FED within the YREB exhibit significant spatial variability and temporal instability. These conclusions can guide the development of reasonable and economic a comprehensive transportation system
Level of Service Optimization Method for Airport Rail Transit Considering Travel Behavior
ZHANG Rui, XUE Ziwei, LIU Xinrui
2024, 42(6): 143-151. doi: 10.3963/j.jssn.1674-4861.2024.06.015
Abstract(38) HTML (18) PDF(10)
Abstract:
This paper aims to balance the utilization rate of transport capacity, level of service and operational profit for airport rail transit, a level of service optimization method for airport rail transit is proposed, considering travel behavior. Specifically, a nested Logit (NL) model considering behavior inertia is established to simulate the landside travel mode choice behavior of passengers accessing the airport. The model includes variables related to behavioral inertia, such as revealed preference (RP) dependence, stated preference (SP) dependence, local residency, and transfer difficulty. On this basis, a level of service optimization model for airport rail transit is built to investigate the relationships among level of service factors, such as ticket price, departure interval, peak hour load factor, as well as market share of rail transit and operation profit of rail transit. Corresponding level of service optimization proposals are then presented. The results of case study conducted in Xi' an city show that: ① SP survey results are influenced by behavioral inertia. Specifically, the current SP questionnaire survey results of respondents are positively dependent on their actual travel choice behaviors and the previous SP survey results, while the dependence on actual travel choice behavior is higher than that on previous SP survey results. ②The proposed NL model, which considers behavioral inertia, outperforms the conventional multinomial Logit (MNL) model that does not account for behavioral inertia. The R-squared value of the NL model is improved by 40.86% compared to the MNL model. ③The proposed optimization model can be solved using enumeration method. If the congestion degree of the current airport rail transit ("somewhat crowded") in the case city is expected to reach the "critical state" threshold, to avoid a decrease in the market share of rail transit and maximize ticket revenue, it is recommended that the ticket price be increased by 3 yuan, provided that the departure interval is reduced by 1 minute.
An Estimation Method of Negative External Cost for Motor Vehicle Pollutants on Ordinary National and Provincial Highways
HUANG Huangqin, GUO Jianhua, ZHAO Yan, SUN Man
2024, 42(6): 152-162. doi: 10.3963/j.jssn.1674-4861.2024.06.016
Abstract(47) HTML (22) PDF(9)
Abstract:
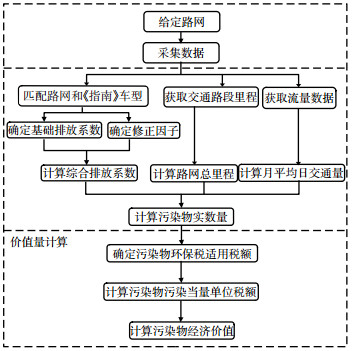
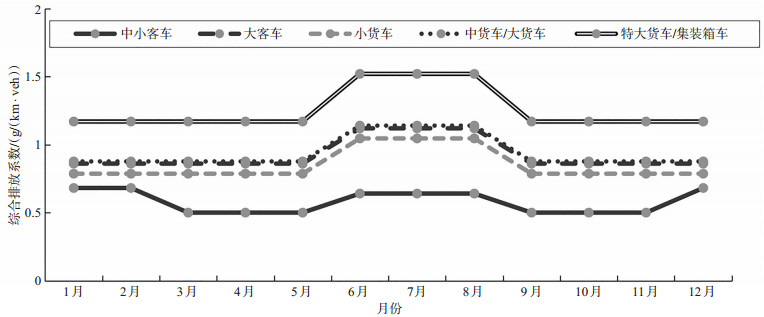
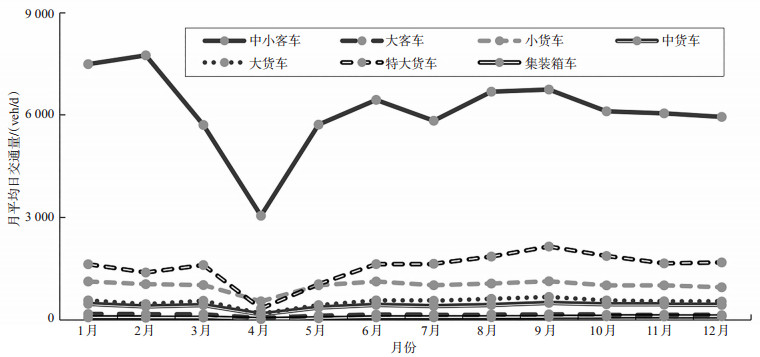
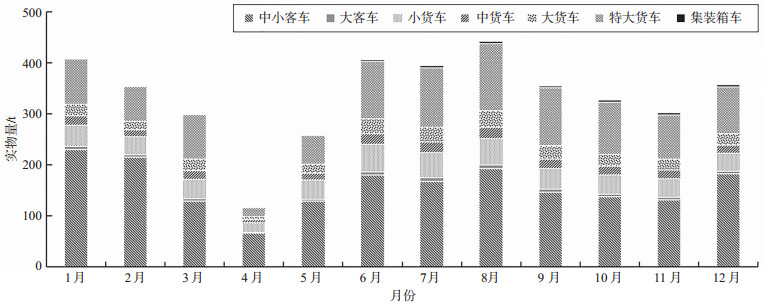
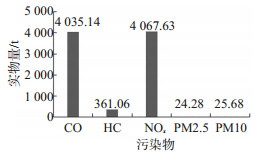
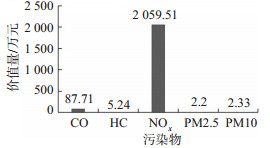
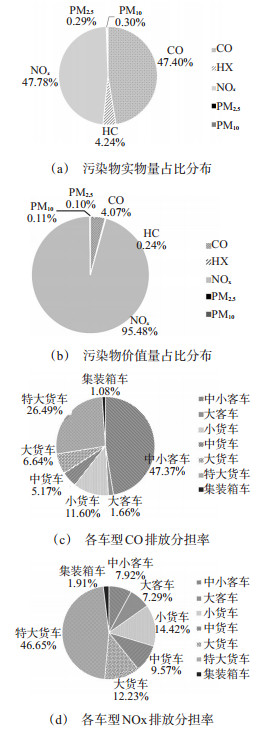
To fully explore the value of traffic information collected by traffic investigation stations on ordinary national and provincial highways, based on traffic operational data, an estimation method is proposed for the motor vehicle pollutants'negative external cost on ordinary national and provincial highways. Based on the given ordinary national and provincial highway networks material, basic road attributes, traffic flow data, motor vehicle technology data, and urban socio-economic data are collected. After that, based on the emission factor multiplier method, the collected data is processed to determine the base emission coefficients for pollutants, environmental correction factors, road traffic condition correction factors, and fuel quality correction factors. Then, the comprehensive emission coefficient, total road network mileage, and monthly average daily traffic volume are derived. Additionally, the quantities of CO, HC, NOx, PM2.5, and PM10 are calculated. Finally, based on the equivalent multiplier method, the economic values of CO, HC, NOx, PM2.5, and PM10 emissions are calculated based on the quantity of pollutants and the unit tax amount of pollution equivalent, which results in the negative external cost of pollutants. The ordinary national and provincial highway network in Xuzhou City is selected to conduct the empirical study. The results show that the total emissions of motor vehicle pollutants from the network in 2022 were 8 514 tons, reflecting a negative external cost of 21.57 million yuan. In addition, the physical quantities of CO and NOx accounted for up to 95% of the total emissions, the negative external cost of NOx accounts for over 95% of the total cost, and passenger cars and medium-sized buses and oversized trucks had higher shares of CO and NOx emissions, indicating that the focus of air pollution control in Xuzhou should be on controlling NOx emissions from these types of vehicles. Compared with the research of other scholars, it can be seen that there are differences in the types of major pollutants and their primary emission sources among different cities. Therefore, the transportation sector should formulate relevant decisions based on actual conditions.
Evaluation of Bus Operation Reliability and Analysis of Influencing Factors Based on Travel Time
Weng Jiancheng, ZHAO Shichang, LIN Pengfei, KONG Ning, QIAN Huimin
2024, 42(6): 163-171. doi: 10.3963/j.jssn.1674-4861.2024.06.017
Abstract(44) HTML (11) PDF(15)
Abstract:
Bus operation is subject to various internal and external factors. To accurately evaluate bus operation reliability and quantitatively analyze the influencing factors. this study calculated the interval travel time based on bus arrival time data. It established a bus operation reliability evaluation method that can reflect the impact of unreasonable delays and the variability of interval travel time by calculating the dynamic threshold probability and coefficient of variation and normalization processing. This method achieves horizontal and vertical comparison of bus operation reliability for different routes and different time periods, solving the problem that the bus operation reliability evaluation method based on schedule deviation is not applicable to high-frequency service bus routes. To address the limitations of existing research, which primarily focuses on single-factor considerations and qualitative analysis, eight influencing factors of bus operation reliability are constructed from perspectives such as station passenger flow, bus route and stop attributes, and road conditions. A Random Forest model is utilized to develop an impact model for bus operation reliability, and its accuracy is compared with that of support vector machine (SVM) and back propagation (BP) Neural Network model. This study used relative importance analysis with partial dependence plots to quantitatively identify key factors and reveal the impact mechanisms. The study uses multi-source bus data from 9 bus routes in Beijing from January 2019 for empirical analysis. The results show that the proposed evaluation method is effective in accurately identifying unreliable bus operations during morning and evening peak hours. The accuracy of the impact model constructed using random forest (RF) is the highest, with improvements of 20.38% and 49.88% compared to SVM and BP Neural Networks, respectively. Key factors influencing reliability include bus stop spacing, bus section speed, and the proportion of dedicated bus lanes, with relative importance values of 26.9%, 25.1%, and 24.1%, respectively. Additionally, the model reveals the nonlinear impact mechanisms of each factor and determines effective threshold intervals. When bus stop spacing is between 600 and 800 m, reliability improves by approximately 12.5% compared to 250 meters. Bus reliability is positively correlated with section speed, with a maximum improvement of around 7%. When the proportion of dedicated bus lanes exceeds 60%, reliability significantly improves, with an increase of about 6.5% when the proportion reaches 95%. Conversely, when the number of signalized intersections along a route increases from 1 to 3, reliability decreases by approximately 4%. To maintain stable reliability, no more than three bus routes should serve the same bus stop.
Travel Mode Choice of Passengers Under Passenger Flow Control of Rail Transit During Public Health Events
DOU Xueping, SHI Lu, DONG Ran, LI Tongfei
2024, 42(6): 172-180. doi: 10.3963/j.jssn.1674-4861.2024.06.018
Abstract(25) HTML (8) PDF(8)
Abstract:
To lessen the negative effects of passenger flow control during major public health events, it is suggested to employ the short-distance buses to transport waiting passengers from the restricted-flow station to the nearby stations that are operating normally. Travel mode choice of passengers toward the short-distance buses is modeled to analyze the feasibility of utilizing short-distance buses to reduce congestions at flow-restricted metro stations. A total of 989 valid questionnaires are obtained using an online survey conducted among residents in Beijing, Shanghai, Guangzhou, and Shenzhen, based on which a Logit model is established to analyze passengers' mode choices during the period of passenger flow control under major public health events. The model explores the determinants of passengers' choice between rail transit as a singular mode and the combined mode of short-distance buses and metro. Furthermore, the effects of passengers' preferences on the probability of choosing the combined travel mode under different levels of epidemic perceptions are also studied. The factors influencing the choices of travel modes of passengers among different cities and groups are compared. The results indicate that punctuality preference, comfort preference, and level of epidemic perception have a positive and significant effect on passengers' choice of the combined travel mode. Specifically, the preference toward punctuality has a significantly positive effect on the travel mode choices of the residents in all the four cities, and it has the largest effect on passengers of long-distance and direct travels. Furthermore, the results of cross-impact analysis indicate that when the epidemic perception is at Level 2 or above, the probability of passengers with a significant preference toward punctuality and comfort choosing the combined travel mode is more than 57% and 53%, respectively. The findings imply that punctual and comfortable short-distance buses can effectively equilibrate passenger distribution among metro stations during major public health events.