01 An Overview of Traffic Management in "Automatic+Manual" Driving Environment
02 An Image Generation Method for Automated Driving Based on Improved GAN
03 An Analysis of Injury Severities in School Bus Accidents Based on Random Parameter Logit Models
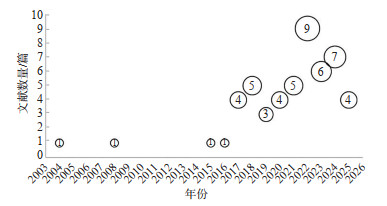
04 A Visualization Analysis and Development Trend of Intelligent Ship Studies
07 An Analysis of Highway-traffic Safety Based on Dynamic Risk Saturation
With socioeconomic development, traffic safety receives increasing attention. This trend has driven traditional in-vehicle navigation technologies to shift from a single efficiency-oriented objective (minimizing travel time) toward a comprehensive optimization of traffic efficiency and safety. However, existing studies still suffer from limitations such as incomplete consideration of data dimensions, low adaptability to user needs, and difficulties in multi-objective trade-offs, which hinder their applicability in large-scale scenarios under future intelligent transportation systems. To address these gaps, this study adopts a systematic literature review approach and analyzes 51 core non-review publications. It focuses on four key research questions: data sources, traffic safety level measurement and prediction methods, safety-aware routing approaches, and technical validation strategies. The review synthesizes the current state of research and identifies core demands in the field, providing references and recommendations for the future development of navigation technologies in intelligent transportation environments. The findings indicate that, in terms of data sources, most existing studies rely on a single data source and fail to adequately capture real-time and microscopic traffic characteristics. Regarding safety level measurement and prediction, many approaches lack differentiation among various types of road units and do not sufficiently explore the evolutionary trends of traffic operational characteristics; moreover, due to challenges in data collection and the complexity of aggregation logic, achieving objective safety quantification remains difficult. For safety-aware routing methods, most studies simplify multi-objective problems into single-objective optimization, where the determination of objective weights lacks objective foundations and sufficient dynamic adaptability; although Pareto-front-based methods avoid explicit weight assignment, they face practical challenges such as reliance on preset parameters and relatively low computational efficiency. In terms of technical validation, real-world field tests provide the highest reliability but are constrained by high costs and limited scalability; simulations and data-driven scenario replay based on real data can effectively reduce testing costs, yet they often lack real-time interactive dynamics and may deviate from actual traffic conditions; subjective evaluation can supplement user perception and feedback, but trade-offs among sample size, participant characteristics, cost, and validity must be carefully balanced. Based on these insights, future research is recommended to focus on four major directions: ① establishing key navigation-related data framework under future traffic information environments. ②Integrating real-time traffic state inference into safety level prediction. ③Incorporating heterogeneous driving styles and personalized user needs to enhance routing techniques. ④Leveraging emerging technologies such as large language models to provide intelligent interaction and decision-support capabilities for next-generation navigation systems.
Autonomous driving technology is accelerating toward large-scale testing and commercial application. Consequently, constructing systematic scenario frameworks for testing and robust evaluation metrics is crucial for safe deployment. This paper reviews the research status, challenges, and future trends of these systems. The study analyzes complexities introduced by vehicle-road-cloud integration and dynamic mixed traffic. It finds that traditional"mileage-failure"statistical models are insufficient for end-to-end performance assessment. Regarding test scenarios, the paper outlines the evolution toward scenario-driven paradigms. It summarizes semantic description methods based on the ISO 34501 standard and the PEGASUS six-layer model. Mainstream scenario generation technologies are also reviewed. Current frameworks show insufficient coverage of long-tail and edge scenarios. Standards are highly fragmented. Furthermore, existing frameworks often under-represent vehicle-to-everything (V2X) collaborative elements due to an excessive focus on single-vehicle intelligence. Regarding evaluation metrics, existing methodologies are categorized into three dimensions, including competition-based, closed-track/simulation hybrid, and theory-oriented approaches. The review identifies several deficiencies in current systems. Specifically, current metrics insufficiently assess the use of V2X collaborative information. Evaluation dimensions and workflows are fragmented, and objective quantitative metrics for interactive experience are lacking. To address these challenges, next-generation testing systems should focus on four research paths. ①Unified scenario description languages and data-sharing frameworks are needed to establish benchmarks for measuring scenario risk criticality and realism. ② Hierarchical scenario systems should be built to cover nominal conditions as well as long-tail boundaries for full-domain coverage. ③Comprehensive metrics should integrate communication latency, system resilience, and social ethics. ④World models and generative AI, combined with causal inference, can simulate extreme conditions and explore unknown failure modes to validate the system's generalization capability.
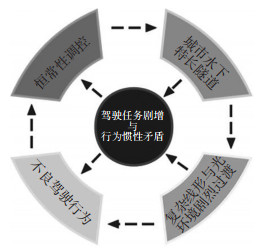
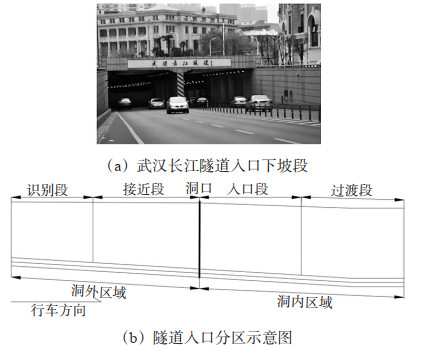
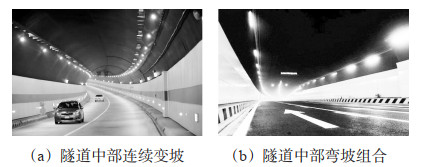
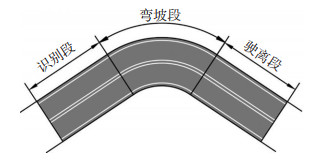
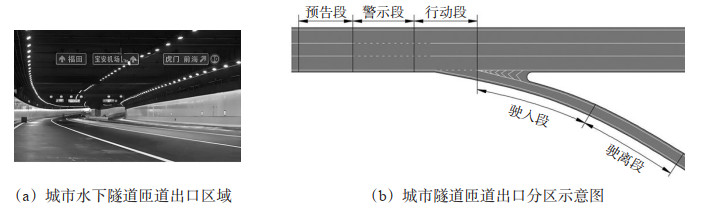
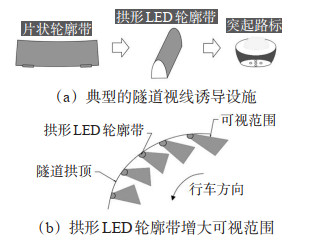
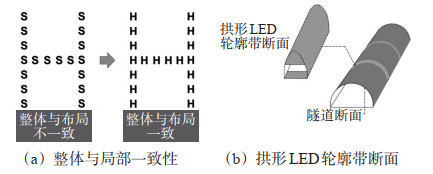
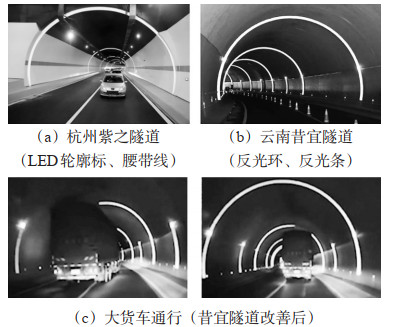
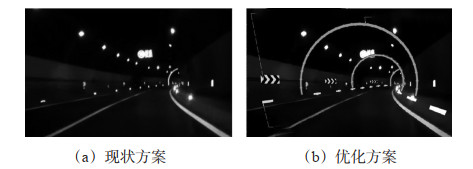
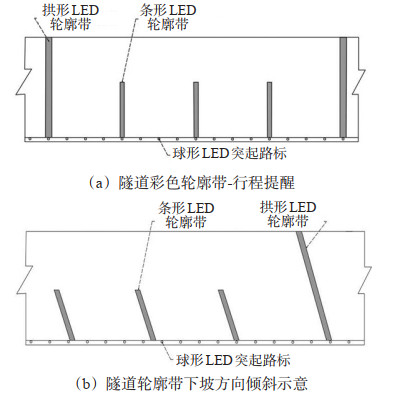
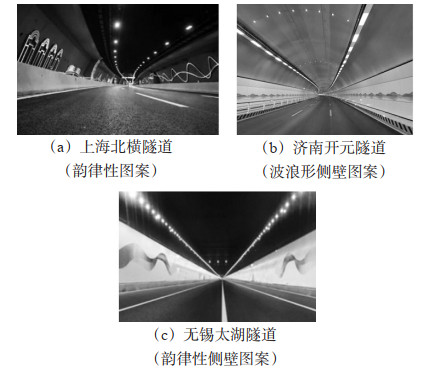
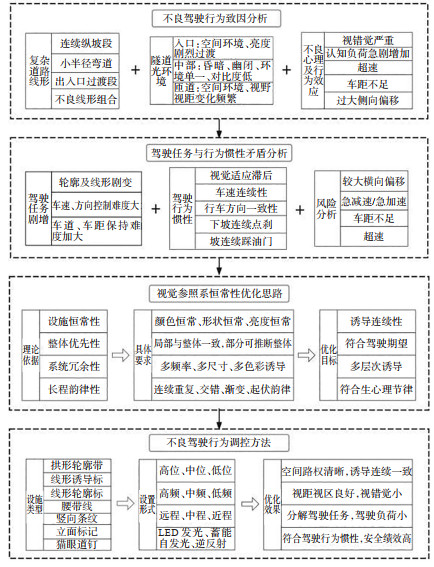
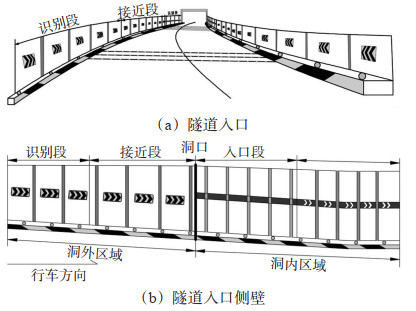
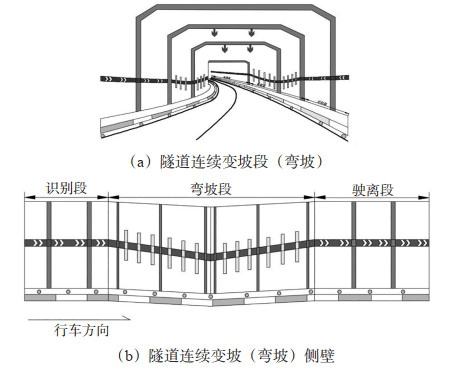
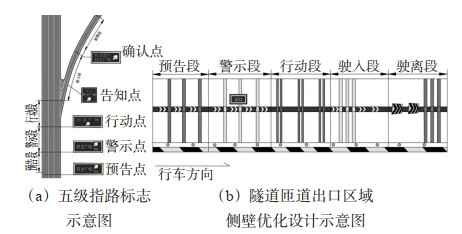
Urban submerged extra-long tunnels typically exhibit three key characteristics: densely clustered ramp entrances and exits, complex and variable alignment profiles, and abrupt lighting transitions. Drivers' real-time cognitive load and driving task increase rapidly. They also create significant conflicts with the inertia of driving behavior in long-distance tunnel. Such conflicts easily induce poor driving behaviors, including speeding, insufficient following distance, and lane deviation. This further heightens accident risks. Based on a systematic review of existing studies on the complex environmental characteristics, driving behavior patterns, and regulatory methods of urban submerged extra-long tunnels, a clear logical chain is established: urban submerged extra-long tunnels—complex geometry and abrupt lighting transitions—escalating driving demands and behavioral inertia—poor driving behaviors— constancy regulation. The paper proposes rational zoning for critical zones, such as tunnel entrances, continuous gradient-change zones, and ramp exits. It analyzes the conflicts between shifting driving demands and behavioral inertia in these zones. Based on this analysis, the study constructs a research framework for investigating and regulating undesirable driving behaviors in urban submerged extra-long tunnels. The research puts forward an optimization approach for tunnel visual reference system. This approach involves enhancing visual reference system in complex alignment zones and moderating environmental changes in transition zones. It can be achieved through a constancy-based visual guidance system. The system features four core attributes: facility constancy, overall priority, redundancy, and long-range rhythmicity. Existing practice demonstrates that this constancy-based visual guidance system aligns with drivers' psychological expectations. It effectively decomposes driving tasks and improves safety in critical zones, such as tunnel entrances, continuous gradient-change zones, and ramp exits. Additionally, the system helps regulate undesirable driving behaviors on complex curved sections of urban submerged extra-long tunnels. Ultimately, it achieves a harmonious balance between tunnel's lighting energy saving and safe, comfortable driving conditions.
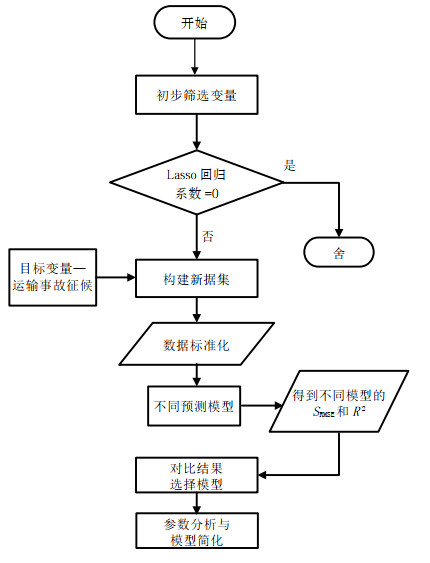
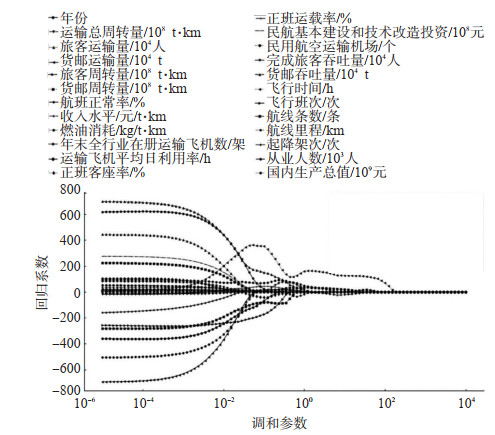
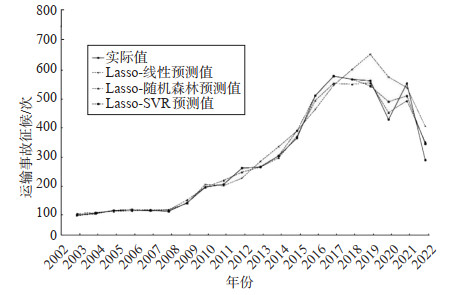
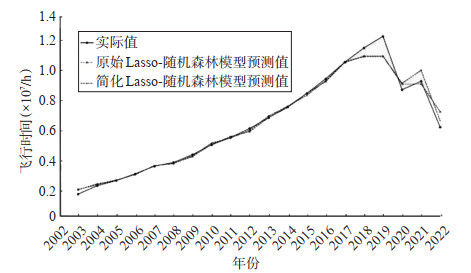
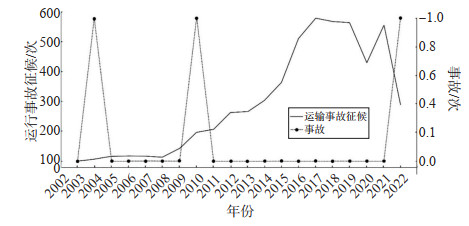
As aviation safety continuously improves, transportation accidents exhibit small-sample and low-probability characteristics. Traditional prediction methods based on historical data struggle to characterize the evolution of aviation operational risks and refined safety management demands. To address prediction instability caused by insufficient accident samples, a method for calculating the target level of safety using a Lasso-random forest model is proposed. The method integrates Lasso regression and a random forest model to improve robustness under low-probability conditions. An influencing factor set for transportation incident precursors is constructed by considering transport scale, operational efficiency, resource input, and operational intensity. Lasso regression combined with time-series cross-validation is applied for feature selection to alleviate multicollinearity under small-sample conditions. This procedure improves the stability and rationality of selected features. A random forest model is employed to predict transportation incident precursors. Feature importance analysis is applied to improve prediction accuracy. An error-driven model simplification strategy is used to reduce model complexity and enhance practical applicability. Civil aviation operational data of China from 2003 to 2022 are used for validation. Results indicate that the Lasso-random forest model achieves the lowest SRMSE value of 45.2 and the highest R2 value of 0.834. The model significantly outperforms linear regression and support vector regression models. After simplification, the SRMSE is further reduced by 6.14%. Based on the simplified model, flight hours and incident precursor occurrences for 2023 are predicted. The resulting en-route aircraft collision safety target level is, which satisfies applicable safety standards. The proposed method provides a robust and operational framework for low-probability aviation risk assessment and safety target level formulation.
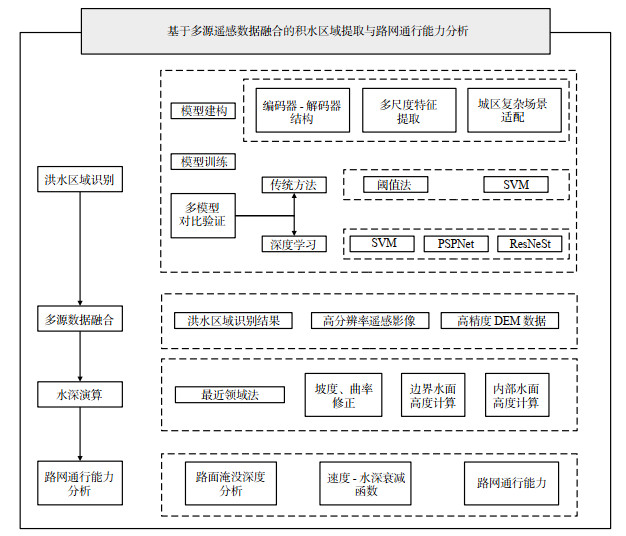
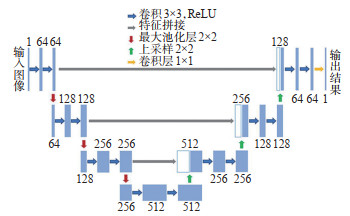
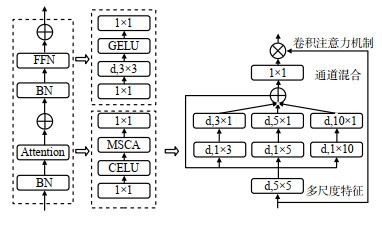
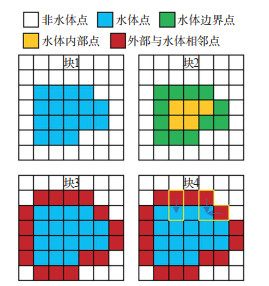
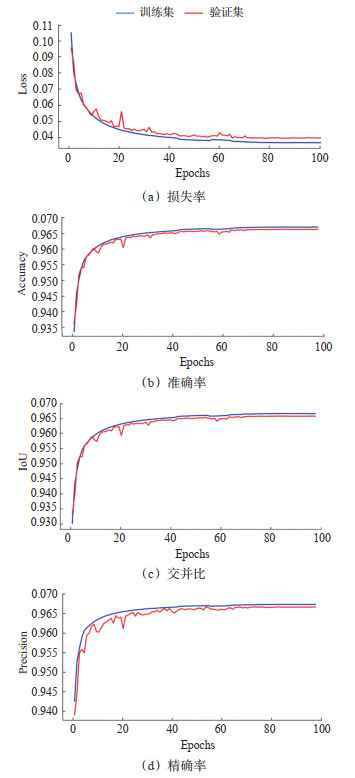
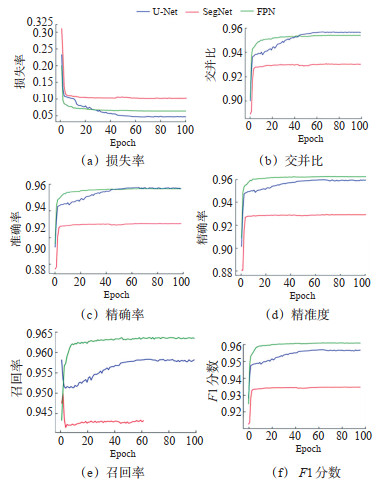
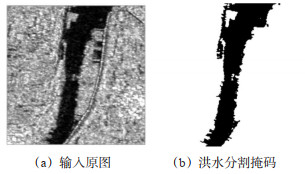
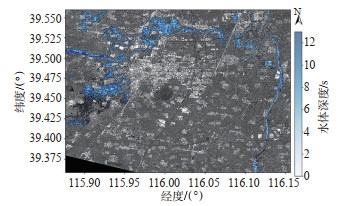
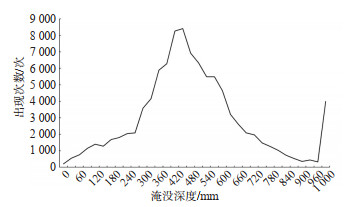
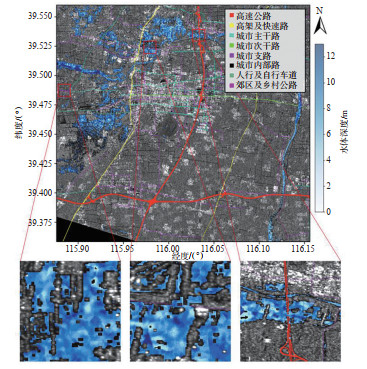
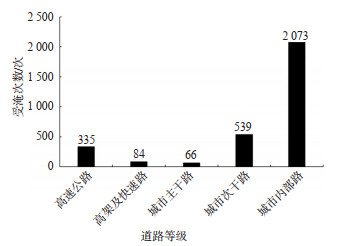
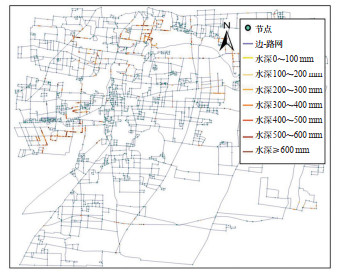
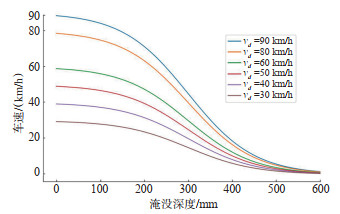
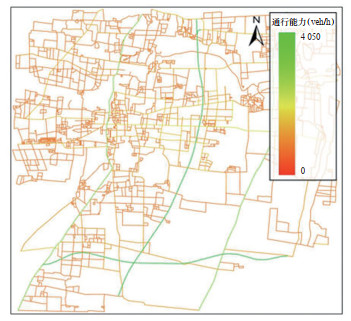
To address the challenge of accurately quantifying urban traffic risks during the dynamic progression of flood disasters, this study proposes a deep learning-based method for high-precision flood area extraction and analyzes the traffic capacity of urban roads during flooding through dynamic hydrodynamic simulations. A dynamic road network traffic assessment framework, encompassing flood detection, water depth calculation, and traffic capacity analysis, is established. This approach integrates synthetic aperture radar (SAR) imagery, optical imagery, and high-resolution digital elevation model (DEM) data, employing a U-Net deep learning model to precisely extract flood areas. By combining remote sensing data and geographic information, along with terrain factors such as slope and curvature, a flood water level boundary model is developed. The system utilizes real-time precipitation and land use information to drive dynamic water flow simulations, and integrates water depth change grids with vectorized road network data to estimate the inundation depth of different road types. A road topology structure and traffic capacity update mechanism are then established, including water depth and vehicle speed attenuation models for different road classes, quantifying the impact of water depth on traffic speed. Based on this model, multi-temporal traffic capacity change maps are generated, and complex network indicators are used to quantitatively assess road network connectivity. Results show that the method effectively addresses challenges such as shadow interference and building occlusion, significantly improving the accuracy of flood area segmentation. Specifically, the Intersection over Union (IoU) and F1 scores for flood area recognition achieved 97.56% and 97.79%, respectively, outperforming the support vector regression (SVR) model, with a 5% improvement across all metrics. The analysis indicates that, with a rainfall of 270.76 mm, the average water depth of internal roads and branches is significantly higher than that of arterial roads and highways. As water depth increases, the traffic speed of roads decreases by approximately 13.2%, with urban roads'traffic capacity reduced by an average of 13.2%. However, arterial roads maintain 83.3% of their traffic capacity, indicating their potential for emergency use. Furthermore, post-flood road network structure deteriorates significantly, with overall network connectivity decreasing by 58.2% compared to pre-flood conditions.
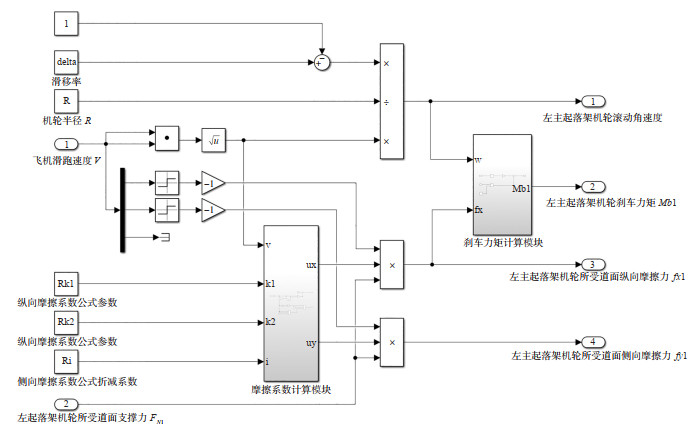
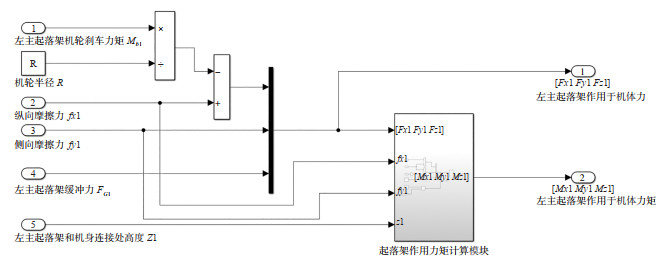
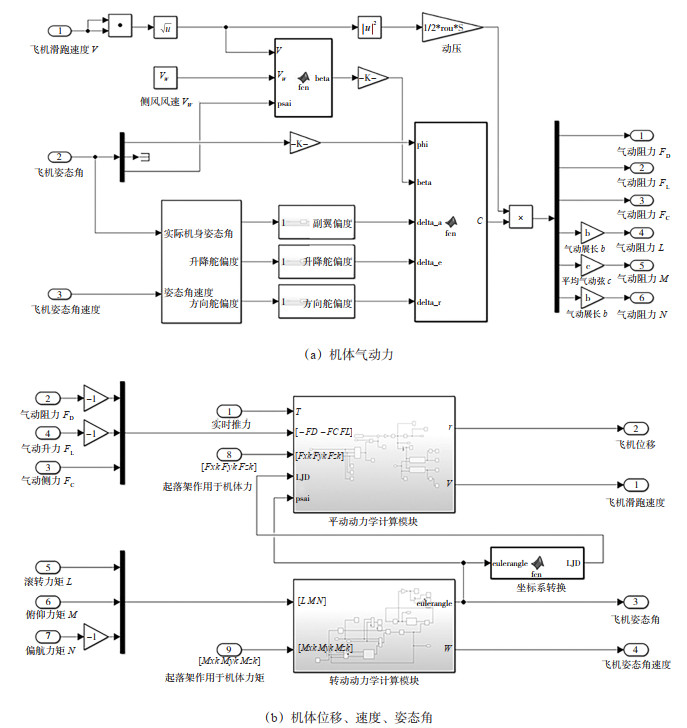
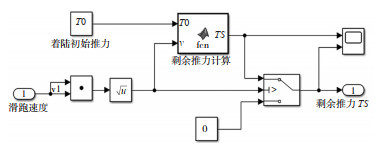
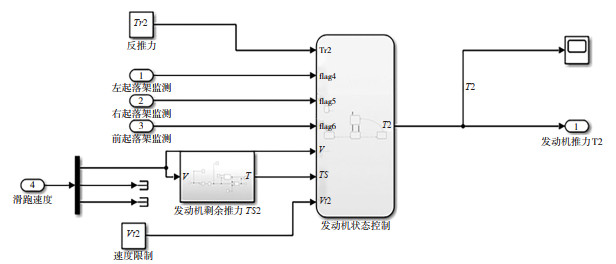
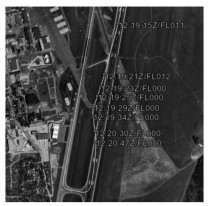
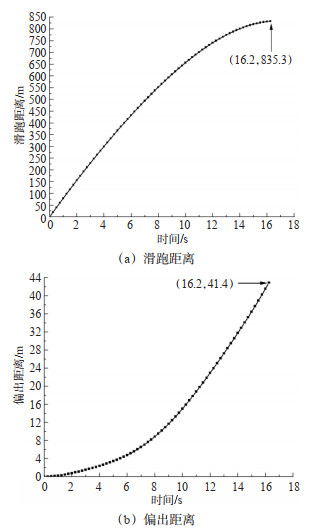
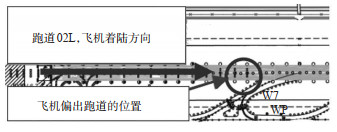
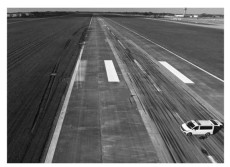
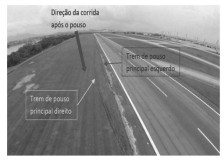
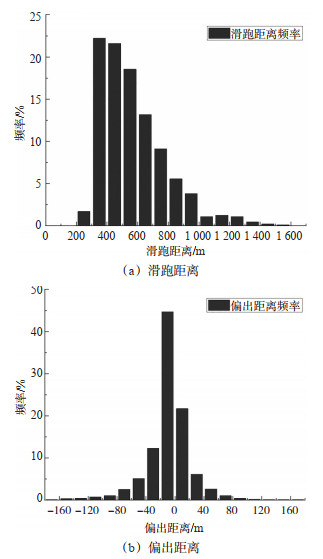
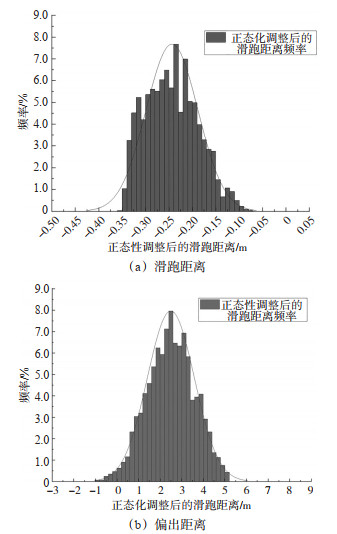
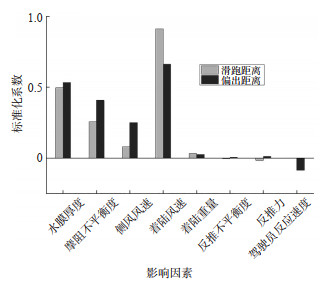
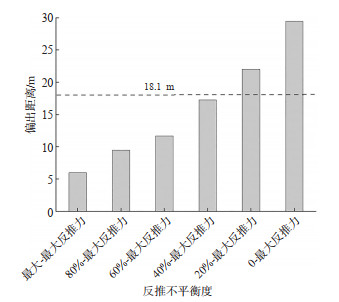
To address the frequent occurrence of runway excursion accidents in aviation safety, this study conducts a quantitative analysis of the factors influencing aircraft landing taxiing states and establishes a corresponding prediction model. A human-aircraft-environment coupled dynamics model for aircraft landing taxiing is developed in Simulink, focusing on the Airbus A320-214. This model incorporates a dynamic engine thrust module and integrates pilot operations, aircraft dynamics, crosswind, and wet runway surface conditions. Closed-loop simulations yield 3, 191 sets of data for analysis. The influence of various factors, such as water film thickness, pilot reaction speed, and touchdown ground speed, on runway excursions is quantified using multiple linear regression. The mechanism of thrust reverser imbalance affecting deviation distance is analyzed, leading to the establishment of predictive models for landing taxiing distance and deviation distance. The findings indicate that during landing taxiing, touchdown ground speed has a greater impact on taxiing distance than on deviation distance. Environmental factors like water film thickness, friction imbalance, and crosswind velocity are more likely to cause runway deviations. Among these, friction imbalance has the most pronounced effect on yaw direction, exceeding the impact of thrust reverser imbalance by a factor of 14.5, which ranks as the second most influential factor. Under specified conditions, a thrust reverser imbalance exceeding 0.4 pushes the deviation distance close to the safety threshold, representing a substantial risk. The multiple linear regression model for taxiing distance prediction demonstrates a coefficient of determination (R2) of 0.88, a mean absolute error (MAE) of 48.32 m, and a mean absolute percentage error (MAPE) of 7.75%. Prediction deviations for actual cases remain within 5%, indicating superior accuracy of the model for predicting aircraft landing taxiing distance.
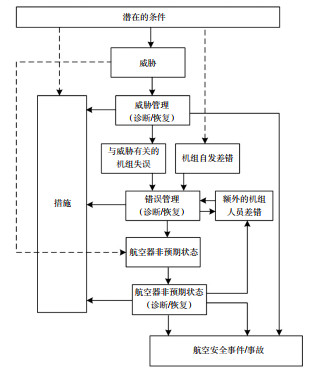
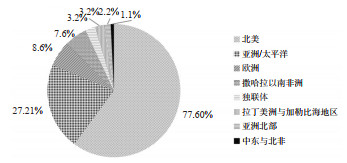
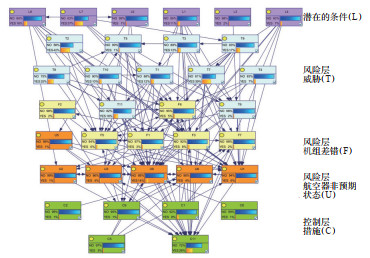
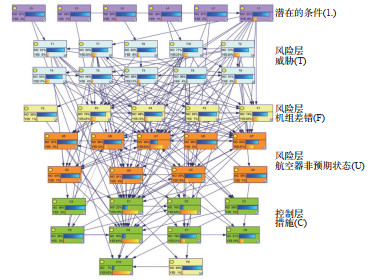
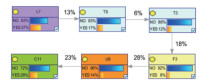
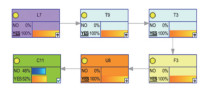
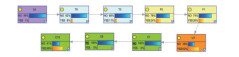
To address the research gap regarding the causal correlations among incidents with varying consequence severities, this study adopts a Safety-Ⅱ perspective and takes controlled flight into terrain (CFIT), a high-risk aviation accident category, as the research object to analyze the causal factors and the interrelationships across samples with distinct outcome levels. A total of 128 CFIT accident investigation reports from the Aviation Safety Network (ASN) and 354 voluntary reports from the Aviation Safety Reporting System (ASRS) are selected as the analytical sample. Guided by the threat and error management (TEM) model, a systematic analysis is conducted to identify latent conditions, threats, flight crew errors, undesired aircraft states, and countermeasures inherent in the sampled accidents, which resulted in the identification of 3 367 causal factors and 2 169 causal-temporal relationships. Following semantic analysis and integration of these relationships, a Bayesian network (BN) model is constructed, resulting in an accident evolution network model comprising 46 BN nodes. Association rule mining is employed to compute conditional probabilities and inter-node correlations, so as to delineate the high-probability causal chains of the samples. Results demonstrate that: ①the primary high-risk pathway leading to CFIT accidents is: operational pressure → flight crew fatigue → loss of situational awareness → incorrect altimeter setting → aircraft deviation from the intended altitude profile. ②When negative factors including flight crew fatigue (accounting for 57% of the identified negative factors) and inadequate management by airlines/regulatory authorities (17%) are present, the probability of CFIT accidents increases by 24%. ③From the Safety-Ⅱ perspective, when positive factors, such as aviation system response measures (with an effectiveness rate of 78%) and the execution of recovery actions (84%) take effect, the probability of a stable approach is enhanced by 34%, thereby significantly mitigating the risk of CFIT occurrences.

Journal of Transport Information and Safety
(Founded in 1983 bimonthly )
Former Name:Computer and Communications
Supervised by:Ministry of Education of P. R. CHINA
Sponsored by:Wuhan University of Technology
Network of Computer Application Information in Transportation
In Association With:Intelligent Transportation Committee of China Association of Artificial Intelligence
Editor-in-Chief:ZHONG Ming
Edited and Published by:Editorial Office of Transport Information and Safety
Address:No. 1178,Heping Avenue, Wuchang, Wuhan, CHINA
Postcode:430063
Tel:027-86580355
E-mail:jtjsj@vip.163.com
Website:http://www.jtxa.net/
Postal Code:38-94
Domestic Issue:
CN 42-1781/U
Publication No.:ISSN 1674-4861
- Chinese Core Journal in “Integrated Transportation” category
- Chinese Science Citation Database (CSCD)
- Core Science and Technology Journals
- Chinese Scientific and Technological Papers and Citations (CSTPCD)
- Class A of Research Center for Chinese Science Evaluation (RCCSE)
- Chinese Academic Journal Comprehensive Evaluation Database (CAJ-CED)
- Chinese Core Journals (Selection) Database
- Chinese Scientific and Technological Periodicals Database
- China National Knowledge Infrastructure (CNKI)
- Chinese Academic Journals (CAJ-CD)
- Chinese Lifelong Education Academic Research Database
- Japan Science and Technology Agency (JST)
- World Journal Clout Index Report (2020 STM)