2023 Vol. 41, No. 1

Display Method:
2023, 41(1)
Abstract(273) HTML (239) PDF(21)
Abstract:
A Method of Identifying Collision Risk of Container Trucks in Port Terminal Areas under an Integrated Connected Vehicle BSM and Roadside Video Surveillance Data
GUO Xiaohan, PENG Liqun, MA Dinghui
2023, 41(1): 1-12. doi: 10.3963/j.jssn.1674-4861.2023.01.001
Abstract(679) HTML (166) PDF(70)
Abstract:
Large container terminals involve high-frequency transportation activities, and limited visibility in areas of stack aisles and exchange zones may easily lead to crashes between port container trucks and facilities, operators, and other vehicles. To improve the trajectory tracking accuracy and driving safety perception ability of intelligent container trucks in the densely populated port areas, a method for identifying container truck collision risks by integrating Connected Vehicle Basic Safety Messages (BSM) and roadside video surveillance data is proposed. A YOLOv5s algorithm is used to extract target vehicles and operators within the video surveillance, and a non-maximum suppression anchor box is designed based on the large size characteristics of the target container to improve detection accuracy. A perspective transformation principle is used to convert the target pixel coordinates into geographical coordinates, and a Deep-SORT algorithm is applied to match the vehicle trajectory information of each frame image. An interactive multi-model method (IMM) is used to fuse video trajectory information and vehicle positioning data of on-board units (OBU), reducing observation errors during target maneuvering process. Based on the trajectory fusion results, a new trajectory conflict risk assessment model is proposed, which can monitor vehicle collision risks in real-time according to the relative motion state of the target container and surrounding target trajectories. The detection of the collision risk can be broadcasted in real-time to on-board terminals and operator terminals through roadside equipment under most of practical scenarios. Experimental results show that the Root Mean Square Error (RMSE) of the IMM adaptive tracking method is only 0.29 m, which is 81.05% lower than that of the on-board tracking trajectory. It verifies that fusing roadside surveillance video with vehicle BSM positioning data can overcome the problem of increased errors from the on-board positioning systems under the dense stack environments. Study results also show that the recall rate, precision, and accuracy of collision risk identification results (with a pre-set ETTC threshold of 2 s) is improved by 7.39%, 4.27%, and 2.50%, respectively. The results indicate that the proposed method can more accurately identify collision risks in cases of obstructed visibility, when compared to the previous methods only using on-board detection techniques.
A Car-following Model for Expressway under Foggy Weather Based on Transfer Learning and LSTM with Small-sample
LIU Qin, SONG Tailong, LI Zhenlong, ZHAO Xiaohua
2023, 41(1): 13-22. doi: 10.3963/j.jssn.1674-4861.2023.01.002
Abstract(639) HTML (195) PDF(49)
Abstract:
Due to the fact that it is difficult to collect car-following samples at different fog levels and the samples that can be collected are limited, and the accuracy of car-following models is generally poor under the condition of foggy weather. A transfer learning (TL) approach is used to improve the performance of a car-following model under the condition of foggy weather based on the long short-term memory (LSTM) neural network technique. A driving simulator is used to set up two types of experimental scenes (normal and foggy weather) for driving experiments on an expressway. Driving behavior data from 296 groups of car-following samples under the condition of normal weather (source domain), and 100 groups of car-following samples under the condition of foggy weather (source domain) is collected. A selection method for transfer samples is proposed based on the longest common sequence solution (LCSS). 100 samples are selected from the source domain and transferred to the target domain. The end-to-end generalization learning capability of the LSTM from features of both source and target domains to output of target domain is improved by expanding the training samples to develop a car-following model for expressway under the condition of foggy weather. To compare the utility of the proposed method in improving the LSTM model, the LSTM-TL model is compared with the LSTM-S model with all training samples from the source domain, and the LSTM-T model with all training samples from the target domain. The mean square error (MSE), root mean square error (RMSE), and mean absolute error (MAE) of the LSTM-TL model is 47.5%, 27.7%, and 46.5% less than the LSTM-S model respectively; while 31.1%, 17.0%, and 29.9% less than the LSTM-T model. To compare the performance of different models when only 100 groups of samples from the target domain are available, the LSTM-TL model is compared with three models, Gipps, IDM, and BP. The MSE, RMSE, and MAE of the LSTM-TL model is 18.5%, 8.0%, and 25.9% less than the Gipps model respectively, which performs best among the three models. Study results also show that the LSTM-S model has poor prediction accuracy when directly applied to the prediction of the target domain, and the use of sample transfer can significantly improve its accuracy. The LCSS method is effective for sample screening from the source domain, and the LSTM-TL model trained by transferring 100 samples from the source domain to the target domain has the highest accuracy. In case of a small sample, the Gipps model with fewer parameters has a better prediction accuracy than the LSTM-T or LSTM-S models. However, the LSTM-TL model still achieves the highest accuracy among all of the above models, due to the fact that the transfer learning can transfer useful knowledge from source domain samples to the target domain.
A Method for Identifying Traffic Congestion Resulting from Accidents on Freeways
ZHANG Chi, ZHOU Yuming, ZHANG Min, LUO Yuwei, CHEN Jiale
2023, 41(1): 23-33. doi: 10.3963/j.jssn.1674-4861.2023.01.003
Abstract(680) HTML (237) PDF(76)
Abstract:
Based on the reliability of travel time, a method for identifying traffic congestion resulting from accidents is proposed, in order to quantitatively study how random congestion takes place on freeway sections and how congestion evolves under various traffic accidents. A model based on the method for studying the reliability of travel-time outlined in the Highway Capacity Manual is developed, which is calibrated based on observed data from a section of a freeway in Southwest China. A Monte Carlo simulation method is adopted to simulate various traffic accident scenarios. These traffic accidents are featured by four characteristics: location, severity, duration, and frequency. The mechanism that traffic congestion takes place and evolves is investigated and travel time index is used to represent the level of congestion on freeway sections under different traffic accidents. Study results show that ①The method presented in the Highway Capacity Manual is portable. ②When traffic volume is closed to saturation, the impact of traffic accidents taking place at the off-ramp sections is higher than those occur in the basic and on-ramp sections, and their impact is much higher under the single-lane closure scenario than that under the shoulder-closure scenario. ③When the traffic flow is close to free flow, the congestion is not sensitive to the accident severity. ④ Congestion would increase dramatically under the single-lane closure scenario when the accident lasts for more than 15 minutes at any traffic volume level. The proposed method for identifying traffic congestion can contribute to detailed exploration of the congestion patterns resulting from traffic accidents as well as classification of the congestion of freeway sections, which shall provide theoretical support to the accident management of relevant highway and transportation departments.
A Method for Detecting Traffic Accidents on Highway Tunnel Sections Based on Abnormal Sound
MA Qinglu, FU Binglin, MA Lian, LI Yangmei
2023, 41(1): 34-42. doi: 10.3963/j.jssn.1674-4861.2023.01.004
Abstract(594) HTML (216) PDF(28)
Abstract:
In response to the need of effectively detecting traffic accidents in highway tunnel sections, a novel acoustic detection method is introduced, so as to study an intelligent way for detecting traffic accidents in tunnels based on abnormal sound. By analyzing the issues of using Short-Term Energy (STE) and Mel-scale Frequency Cepstral Coefficients (MFCC) in identifying accident sections and interfering with precision, a modified fusion feature MFCCE is proposed to detect traffic accidents in tunnel sections. The new fusion feature of the MFCCE is obtained by extracting STE and MFCC features in virtue of Principal Component Analysis (PCA) to conduct feature fusion. Based on an observed traffic accident dataset, a sample dataset of noise experiments in two tunnels containing braking and collision sounds is developed, which corresponds to the traffic scenario of morning peak hours (from 07:00 to 08:00) and regular hours (from 12:00 to 13:00) respectively. Then an endpoint detection method is utilized to validate the proposed method, which is then compared with the other two methods (STE and MFCC). The Pearson correlation coefficient is determined as the final evaluation method, through which correlation coefficients r is used to compare the positive correlation of the three test results with the original samples. Experimental results show that the correlation coefficients of STE are 0.933 and 0.988 in the regular and morning peak hours respectively; the correlation coefficients of MFCC are 0.998 in both regular and morning peak hours, while the correlation coefficient of MFCCE (0.999) is higher than the other two detection methods in both regular and morning peak hours. The average correlation coefficients of MFCCE are 3.95% and 1.00% higher than the other two detection methods, respectively.
An Analysis of The Impact Factors of Head Injuries of Two-wheeler Riders Using a Latent Class Logit Model
YIN Hao, LIN Miao, WANG Peng, ZHU Tong, WEI Tianzheng
2023, 41(1): 43-52. doi: 10.3963/j.jssn.1674-4861.2023.01.005
Abstract(487) HTML (210) PDF(35)
Abstract:
This paper studies the impact factors of head injuries of two-wheeler riders via a novel latent class Logit model. The seriousness of the head injuries of the riders is used as the dependent variable, while the factors of drivers, vehicles, roads, environment, and characteristics of collisions are taken as independent variables. A multinomial Logit model is developed with a significance level of 0.05. On this basis, the optimal number of classes is determined according to the goodness of fit. A latent class Logit model is developed based on 2806 two-wheeler collision data collected by the China In-depth Accident Study (CIDAS). According to the results, the model divides accident samples into two distinct categories. The two groups differ significantly in terms of parameter values, variable distribution characteristics, and the likelihood of predicting the outcome. Specifically, accidents with characteristics such as"two-wheelers initial speed is greater than 30 km/h"and"throwing distance is greater than 10 meters"are more likely to be classified as Class 1, which refers to the riders with more severe head injuries. In addition, severer head injuries are likely to occur under the following scenarios: including when a rider is over fifty, the colliding vehicle is a commercial truck, the two-wheeler is a motorcycle, the accident occurs outside a city, the two-wheeler is traveling above 30 km/h, the head collides with the glass, and the distance to the collision site after the collision is greater than 5 meters. Moreover, the risk of serious two-wheeler collisions is higher when a car driver intends to park or change lanes. Helmets are shown to reduce head injuries among riders.
A Model of Risk Classification and Forewarning for Pedestrian Crossing Behavior at Unsignalized Urban Roadways
CHU Zhaoming, CHEN Ruixiang, LIU Jinguang
2023, 41(1): 53-61. doi: 10.3963/j.jssn.1674-4861.2023.01.006
Abstract(471) HTML (208) PDF(51)
Abstract:
To quantify the collision risk for pedestrian crossing at unsignalized urban roadways, a method for classifying such risk is proposed based on a K-means algorithm, and a forewarning model is also developed based on random forest technique. Three indicators, conflict time difference to conflict, potential collision distance, and potential collision energy, are selected to describe the real-world human-vehicle interactions by considering their temporal and spatial proximity and the severity of potential collisions. A K-means algorithm is applied to cluster the states of pedestrian crossing risk and classify the corresponding risk into different levels. Thirty indicators are proposed by analyzing the potential risk factors from the following five aspects, including weather, traffic facilities, behaviors of traffic participants, historical accidents, and others presented in the process of pedestrian crossing. An optimal set of forewarning indicators is extracted after screening the above indicators according to the Gini purity. Taking the optimal set as the model input, a hierarchical forewarning model which can refine and predict the pedestrian crossing risk is developed by using a random forest algorithm. The accuracy of the model is verified based on three pedestrian crossing datasets collected in a city of Shanxi Province. Experiment results show that quantitative classification is consistent with the real-world pedestrian crossing scenarios when the level of pedestrian crossing risk is divided into 5 levels. The overall accuracy of the hierarchical forewarning model reaches 86.67%. The accuracy of identifying level Ⅰ and level Ⅳ risk are even higher, as their accuracy reaches 100% and 94.7%, respectively. The proposed method also mitigates several issues from the models presented in the previous studies, such as incomplete risk indicators, unrealistic risk classification and unrefined warning level, and improves the accuracy of risk forewarning for pedestrians crossing streets.
A Method for Clustering Ship Trajectory through Extracting Multiple Feature Points
NIU Wenyu, LIANG Maohan, LIU Wen, XIONG Shengwu
2023, 41(1): 62-74. doi: 10.3963/j.jssn.1674-4861.2023.01.007
Abstract(749) HTML (180) PDF(58)
Abstract:
Trajectory clustering plays a significant role in the fields of ship behavior analysis and maritime regulation. Due to the inconsistent length and sampling rate of ship trajectories, as well as significant structural differences, it is difficult to achieve a high accuracy and efficient clustering for large numbers of ship trajectories in wide water areas. To address these problems, we propose to first take full advantage of the massive ship historical voyage data collected from the automatic identification system (AIS), and then extract the positional features related to the ship navigation behavior and traffic density. An efficient ship trajectory clustering method is finally presented by exploiting the multi-feature points. Moving ships, in general, have the characteristics of maintaining a similar direction and speed in most cases, the data compression method can thus be used to capture the trajectory points with significant changes in the navigation process and then extract them as the ship trajectory structure feature points. When ships come across encounters, a method for estimating the probability density is used to analyze the spatial distribution characteristics of ship traffic flow and extract their trajectory points as traffic flow feature points. To remove outliers in these two classes of feature points, a density clustering algorithm is employed to cluster the high-quality feature points, which further improves the reliability of feature points. The center of each class in the clusters is then used as the representative feature points. The distribution of ship trajectories passing through representative feature points is counted, considering ship trajectories with similar distribution as the same class. Numerous experiments have been carried out based on real-world AIS data, collected from the Chengshantou waters, the southern trough of the Yangtze River estuary, and the Zhoushan waters, to compare our proposed model with four typic clustering methods, i.e., the K-medoids clustering, the hierarchical clustering, the spectral clustering, and the density-based spatial clustering of applications with noise (DBSCAN). In the above-mentioned typical waters, the average silhouette coefficient is improved by approximately 53%, 71%, 63% and 41% and the Davies-Bouldin index is decreased by approximately 57%, 67%, 63% and 45%, respectively. At the same time, the method can reduce the clustering time by about 56% on average, which significantly improves the efficiency of ship trajectory clustering.
A Time-of-the-day Partitioning Method for Traffic Signal Control Based on Key Intrinsic Mode Functions
FENG Bin, XU Jianmin, LIN Yongjie
2023, 41(1): 75-84. doi: 10.3963/j.jssn.1674-4861.2023.01.008
Abstract(422) HTML (152) PDF(14)
Abstract:
Traffic signal control is an important tool to relieve urban traffic congestion and time-of-the-day partition is the basis for optimizing multi-period signal control at isolated signalized intersections in that a proper partition can significantly improve the efficiency of traffic control. For an intersection with a fixed-timing signal control strategy, traditional methods for time-of-the-day partition are usually based on experiences or simple clustering algorithms. These methods use historical traffic flow data to directly divide a day into several time periods, which fail to consider the stochasticity of traffic flow and the regularity of time sequence and lead to no contributions to the overall effectiveness of traffic control. To overcome this problem, this study proposes a new method for time-of-the-day partition, which uses an ensemble empirical mode decomposition (EEMD) and a fisher clustering algorithm. The intrinsic mode function (IMF) and corresponding residual from traffic flow data are extracted using EEMD. The Pearson correlation coefficient is calculated to analyze the relationship between the IMF, the residual, and the original traffic flow. The IMF or the residual that gives the highest correlation coefficient is identified as the key component, which replaces the traffic flows in the fisher clustering and partitioning process. The optimal number of clusters is determined by identifying the elbow point of the minimum loss values with different numbers of clusters, and the optimal time-of-the-day partition plan is obtained. A case study based on an intersection in the City of Zhongshan, Guangdong Province, is conducted to verify the proposed method. Simulations are carried out using the VISSIM software and study results show that ①Compares to the current situation, the proposed method can increase the number of vehicles going through the intersections by about 11.32% and 2.62% and can reduce the queue length by about 18.67% and 12.02% on weekdays and weekends, respectively. ②The proposed method also can reduce the average vehicle delay by 6.80% and the stopped delay by 5.87% at weekends, but cannot change both much during weekdays.
A Method for Classifying Driving Behavior Based on Vehicle Position and Speed
ZHANG Weichong, YANG Tao, LYU Nengchao
2023, 41(1): 85-94. doi: 10.3963/j.jssn.1674-4861.2023.01.009
Abstract(500) HTML (176) PDF(37)
Abstract:
Vehicle trajectory data contains vehicle movement information, including time stamp, vehicle position, speed, etc. By analyzing vehicle trajectory data, driving patterns can be classified. As important features from such data reflect driving behavior, vehicle positioning characteristics have been widely studied, but the others such as speed and acceleration are rarely analyzed. In order to incorporate the multi-dimensional information from vehicle trajectory data into the analysis framework, a method for classifying driving patterns based on the characteristics of vehicle position and speed is studied. To overcome the issue of a single dimension of the existing classification methods, the algorithm for Hausdorff trajectory distance is applied to calculate a comprehensive distance matrix of vehicle position and speed. Given the fact that the robustness of the Hausdorff distance algorithm is low, the algorithm is improved by using 90% percentile value of the one-way Hausdorff distance to reduce the influence of noise. At the same time, vehicle position and speed are introduced to further improve the accuracy of classification, and a multiple hierarchical clustering algorithm is used to classify the trajectory diagrams of position and trajectory diagrams of speed in sequence. At the end, the driving patterns based on vehicle position and speed are obtained. The HighD dataset is used as a sample, the vehicle trajectories on three lanes are extracted to verify the proposed classification method. Study results show that ①the proposed method can provide the comprehensive driving patterns of vehicle position and speed, and the average accuracy of clustering is 94.8%, which is higher than the accuracy of DBTCAN (89.3%) and t-Cluster (86.4%). ②Based on the analysis of trajectory deviation curve of lane changing, four typical driving patterns are obtained. The proposed method can use multidimensional trajectory data to classify driving patterns, which has potentials in trajectory classification and identifying abnormal behavior.
A Ship Detection Algorithm for Infrared Images under Hazy Environment based on an Improved YOLOv5 Algorithm
MA Haowei, ZHANG Di, LI Yuli, FAN Liang
2023, 41(1): 95-104. doi: 10.3963/j.jssn.1674-4861.2023.01.010
Abstract(632) HTML (240) PDF(58)
Abstract:
Accurately detecting ships from surveillance images is crucial for intelligent ship traffic surveillance around port waters. To address the issues of low accuracy and capability of small target feature extraction from traditional YOLOv5 object detection algorithms from the infrared images under hazy weather, an improved YOLOv5 algorithm based on Swin Transformer is proposed. To expand the diversity of the original dataset, the improved algorithm considers the characteristics of ship infrared images with strong resistance to cloud and fog interference but blurred image contour features and low contrast, and enhances the dataset based on an atmospheric scattering model. To enhance the algorithm's attention to global features during feature extraction, the backbone network of the improved algorithm uses Swin Transformer to extract ship infrared image features and expands the window view range using a multi-head self-attention mechanism controlled by a sliding window. To enhance the capability of extracting spatial features of dense small targets, a multi-scale feature fusion Path Aggregation Network (PANet) is improved by adding a bottom-up feature sampling module and a coordinate attention (CA) mechanism, in order to capture the position, direction, and cross-channel information of small target ships. To reduce false negatives and false positives, a complete intersection over union loss function (CIoU) is used to calculate the coordinate prediction loss of the original bounding box and combined with the non-maximum suppression algorithm (NMS) to judge and filter candidate boxes in a multi-loop structure to improve the reliability of object detection. Study results show that under certain concentrations of haze, the average recognition accuracy, recall rate, and detection rate of the improved algorithm is 93.73%, 98.10%, and 38.6 frames per second, respectively. Compared with the following algorithms: RetinaNet, Faster R-CNN, YOLOv3 SPP, YOLOv4, YOLOv5, and YOLOv6-N, the average recognition accuracy of the proposed algorithm is improved by 13.90%, 11.53%, 8.41%, 7.21%, 6.20%, and 3.44% respectively; and the average recall rate is improved by 11.81%, 9.67%, 6.29%, 5.53%, 4.87%, and 2.39%, respectively. The proposed Swin-YOLOv5s algorithm has a strong generalization ability for ship target recognition of different sizes and has a high detection accuracy, which helps to improve the surveillance capability of ships around port waters.
A Detection Method for Pavement Cracks Based on an Improved U-Shaped Network
HUI Bing, LI Yuanjian
2023, 41(1): 105-114. doi: 10.3963/j.jssn.1674-4861.2023.01.011
Abstract(560) HTML (195) PDF(36)
Abstract:
Due to the traditional crack segmentation algorithm is difficult to identify narrow cracks and the segmentation edge is not accurate. This paper proposes a pavement crack detection method based on improved U-Shaped Network (Unet) to increase detection accuracy. Since traditional Unet is a type of"shallow"neural network, it is not good for extracting complex crack features. The Oxford University Visual Geometry Group Network (VGG16) is therefore used for feature extraction, in order to improve the accuracy of crack feature extraction. In addition, the fusion of high- and low-order features generate several useless features. The compression and excitation unit (SE block) is added to the decoding part of the model to develop a crack attention unit which allows the network to focus on the crack features under different channels. Moreover, an improved Unet is proposed by combining SE block with VGG16 (SE-VUnet). In addition, a transfer learning method is used to transfer the pre-trained VGG16 network weight on ImageNet for crack detection. By selecting the Crack500 data set and using the camera to collect images to develop1600 pavement crack data sets, the SE-VUnet model is trained again to obtain the crack segmentation results. The weighted harmonic mean F1 of Precision and Recall and Jaccard similarity coefficient are used as quantitative evaluation indicators. The segmentation effect and real-time performance of SE-VUnet are compared with Unet and three other representative models. Study results show that the comprehensive F1 and the Jaccard coefficient of SE-VUnet model is 0.840 3 and 0.722 1, which is 1.04% and 1.51% higher than Unet respectively, as well as other three comparison models. The time for the SE-VUnet to screen a single-frame image is 89 ms, which is only 5ms slower than the Unet but with a significant improvement over the crack segmentation and detection process.
A Method for Predicting Air Traffic Flow Based on a Combined GA, RBF, and Improved Cao Method
WANG Lili, ZHAO Yunfei
2023, 41(1): 115-123. doi: 10.3963/j.jssn.1674-4861.2023.01.012
Abstract(449) HTML (169) PDF(19)
Abstract:
Considering the chaotic characteristic of air traffic flow time series data, a prediction model based on the phase space reconstruction theory is proposed to improve the accuracy and effectiveness of previous air traffic flow prediction methods, which combines genetic algorithm (GA), radial basis function (RBF) neural network (NN) and improved Cao method. First, to reduce the error introduced by the human in the traditional Cao method and improve the accuracy of phase space reconstruction, the criteria for determining the dimension of the reconstructed phase space is developed by identifying false neighboring points and iteratively comparing the deviation of the embedded dimension with its acceptable limits. In this way, reconstructed air traffic flow time series data is developed. Secondly, to improve the prediction accuracy of the traditional RBF neural network, GA is employed to optimize center vectors, weight coefficients, and output layer thresholds of the neural network. Then, the reconstructed time series are predicted by the calibrated RBF neural network with optimal coefficients. Finally, the proposed method is verified using the observed air traffic flow data, the effectiveness of the prediction is evaluated, and the influence of the time scale on the accuracy is analyzed by incorporating the maximal Lyapunov exponent and the quality of the prediction. Study results show that ①the proposed method fits the nonlinear data well and improves the accuracy of traffic flow prediction. ②Taking the prediction with a 5-min time interval as the instance, compared with the traditional RBF neural network, the mean absolute errors (MAE), mean square errors (MSE) and mean absolute percentage error (MAPE) is reduced by 19.44%, 34.78%, and 27.21%, respectively. ③Compared with the back propagation (BP) neural network and the long short-term memory (LSTM) neural network model, the MAE of the proposed method is reduced by 36.20% and 16.10%, respectively, and the response speed is increased by 27.42% and 35.00%. In summary, the proposed method can explain the intricate chaotic properties of the system and improves the accuracy and efficiency of air traffic flow prediction.
A Recursive Framework-based Approach for Real-time Traffic Flow Forecasting for Highways
CHEN Yu, WANG Wei, HUA Xuedong, ZHAO De
2023, 41(1): 124-131. doi: 10.3963/j.jssn.1674-4861.2023.01.013
Abstract(504) HTML (133) PDF(49)
Abstract:
Real-time and accurate traffic flow forecasting is a prerequisite for intelligent management and control of highways, which requires an effective approach for data processing as well as for meeting the real-time requirement. However, few studies have considered the accuracy of traffic flow forecasting for highways from a real-time perspective. Based on this consideration, a recursive framework for traffic flow forecasting is developed combining adaptive Kalman filter (KF) and long short-term memory (LSTM) autoencoder to meet the real-time and accuracy requirements of intelligent transportation systems. Historical data of traffic flow and speed are adopted, and smoothed by a KF method to enhance the prediction accuracy. An unsupervised machine learning algorithm, LSTM autoencoder, is introduced to model the time-varying characteristics of highway traffic flow efficiently. Considering the real-time requirement of traffic flow forecasting for highways, a recursive forecasting framework is proposed. The output of the KF algorithm is replaced by the predicted value of LSTM autoencoder. Based on the real-time data, the adaptive KF algorithm is conducted to correct the current optimal state value. A case study is conducted based on a real-world traffic dataset collected from the Minnesota Twin Cities, USA. Study results show that the recursive framework of forecasting the highway traffic flow proposed in this study has relatively competitive advantages in terms of both computational cost and prediction accuracy. The mean absolute percentage error of prediction is 5.0% (< 7.4% of the combined KF and LSTM autoencoder model); and total training time is 85 s, which is lower than the standard LSTM (101 s).
A Method for Optimizing the Design of Evacuation Streamline for Multimodal Passenger Transportation Hubs
LI Xinghua, WANG Tianzuo, ZHANG Xiaoguang, ZHAO Junjian, CHENG Cheng
2023, 41(1): 132-139. doi: 10.3963/j.jssn.1674-4861.2023.01.014
Abstract(444) HTML (152) PDF(26)
Abstract:
Multimodal passenger transportation hubs are typically crowded by pedestrians, and are composed of complex corridor networks, multiple entrances, and exits. It has been challenging to improve the evacuation efficiency of multimodal passenger transportation hubs. To address this challenge, most of previous studies focus on the layout redesign of facilities, while this study proposes a method to fully utilize the existing facility capacity by controlling the opening/closing state and walking direction of corridors. A simulation-based optimization framework for designing the evacuation streamline is proposed, including system input, simulation for the evacuation process, and optimization modules for the evacuation streamline. The input module of the system requires to specify the following three parameters: evacuation demand, evacuation network, and evacuation behavior. The evacuation simulation module is used to evaluate the efficiency of passenger evacuation under a specific plan of evacuation streamline. The optimization of evacuation streamline plan is conducted by the optimization module based on the results of evacuation simulation runs. Regarding the evacuation simulation, as pedestrians may dynamically modify their evacuation routes, a dynamic model for simulating route choice behavior is developed based on the Logit modeling framework. An optimization model of evacuation streamline is designed to minimize overall evacuation time, total evacuation duration of all individuals, and the level of maximum corridor saturation. An optimization algorithm for multi-objective evacuation streamline is developed based on the NSGA-Ⅲ. The proposed method is validated based on an evacuation scenario of the arrival level of Hongqiao Railway Station. Study results indicate that, compared to the conventional evacuation scenarios without an optimized design of evacuation streamline, the overall evacuation time, total evacuation duration and corridor maximum saturation of the optimized scenario are reduced by 36.2%, 16.6%, and 51.6%, respectively. In general, the proposed method should be beneficial for developing a safe and efficient pedestrian evacuation plan for the multimodal passenger transportation hubs.
A Method for Analyzing the Distribution of Spatial Orientation and Structural Characteristics of Trunk Bus Network
PEI Yulong, SHEN Chen, ZHAI Shuangzhu
2023, 41(1): 140-150. doi: 10.3963/j.jssn.1674-4861.2023.01.015
Abstract(454) HTML (133) PDF(13)
Abstract:
Trunk bus network (TBN) with a reasonable spatial structure can improve the efficiency of urban public transport services, and reduce traffic congestion on roadways. In order to analyze the characteristics of spatial structure of urban TBN, this paper develops a method by analyzing GIS information of bus network with a topological structure model. Referring to the previous method for analyzing spatial characteristics of road network, a method for calculating the orientation entropy of bus lines and that of bus networks is proposed based on the Shannon entropy theory, respectively. According to the spatial orientation of bus lines between adjacent stations extracted from its topological structure of a TBN, the distribution of spatial orientation of bus lines and networks is measured by their orientation entropy, respectively. Based on the existing standards and studies, the indicators that can reflect the characteristics of spatial structure of bus networks are selected and then combined with orientation entropy to develop a set of evaluation indicators for analyzing spatial structure of TBN. Then, the distribution of spatial orientation and the characteristics of the network structure of TBN are analyzed at the following two levels: line and network. A case study is conducted for the bus network consisting of 63 trunk bus lines in the City of Harbin. Regarding the distribution of spatial orientation of TBN, experiment results show that the orientation entropy of the TBN is 2.84, which is greater than the orientation entropy of any single line within the sample. It is verified that the measured orientation entropies of the bus lines are consistent with their observed patterns. The orientation entropy can effectively quantify the distribution of spatial orientation of the topological structure of bus network; In addition, it is found that the correlation between the orientation entropies of bus lines and the length of bus lines is the highest, followed by that between the repetition coefficient of adjacent bus stations and the number of smart cards used at those stations. In the respective of the characteristics of network structure, experiment results show that the average coefficient of concentration of the TBN consisting of 63 lines in the City of Harbin is 0.467, and the goodness-of-the-fit of the distribution of nodes in the network is 0.978, indicating that the network has a tendency of preferential development, and the network structure is relatively stable. In conclusion, the proposed method based on the Shannon entropy provides an alternative way to describe the distribution of spatial orientation of bus network and can be used to support the planning of the TBN.
A Joint Mode Choice Behavior Model of Long-distance Intercity Passenger Travel during the Periods with Regular Epidemic Prevention and Control Measures
FANG Ruitao, SHAO Haipeng, LIN Tao
2023, 41(1): 151-160. doi: 10.3963/j.jssn.1674-4861.2023.01.016
Abstract(463) HTML (122) PDF(24)
Abstract:
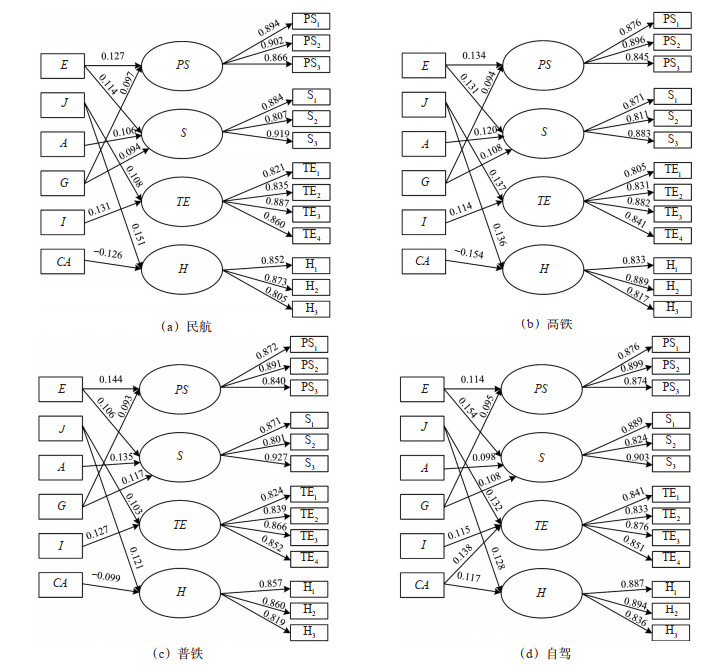
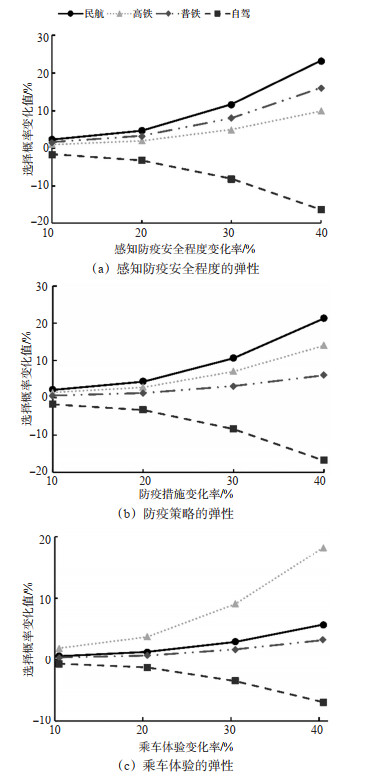
The impact of COVID-19 on long-distance intercity travel is enormous. Existing studies have investigated the impact of COVID-19 on intercity travel at the early stage of the epidemic outbreak, while few of them have studied its impact during the periods with regular prevention and control measures. To fill the gap, this paper focuses on the mode choice behavior of long-distance intercity travel under the impact of regular prevention and control measures of the COVID-19 epidemic. First, a set of multiple indicators and multiple causes (MIMIC) models are developed for civil aviation, high-speed rail, train, and passenger car, independently, and each covers the four modes. The perceived level of safety of prevention measures, epidemic prevention strategies, riding experience, and travel habits are considered in the MIMIC choice behavior model, which are used to explore the relationship between observed and latent variables, to identify the parameters of the model, and to estimate each latent variable. Secondly, to investigate the impact of passengers' psychology on their travel mode choices, a MIMIC-Logit model considering the characteristics of travel modes, socio-economic attributes of passengers, and latent variables is developed. Then, assuming that the random coefficients of passengers' travel expenses, travel time, and travel distance follow a normal distribution, the Halton sequence drawn from the original data through 1000 samplings is used to estimate the utility coefficients of the MIMIC-Logit model. Lastly, the survey data of passengers arriving in Xi'an between April and June 2021 is employed to validate the proposed model. Study results show that (1) the goodness of fit and hit ratio of the MIMIC-Logit model with latent variables is 43.621% and 83.312%, respectively, which are higher than the comparative multinomial-Logit model and the random coefficient Logit model; (2) the preferences of passengers towards different travel modes of travel expenses, travel time, and travel distance are heterogeneous, and the characteristics of travel modes, socio-economic attributes, and latent variables all have a significant impact on mode choices; (3) when the variables representing perceived level of safety of the COVID-19 prevention measures and epidemic prevention strategies is increased by 100%, the probability of choosing civil aviation is increased by 23.207% and 21.349%, respectively; (4) when the variable representing travel experience is increased by 100%, the probability of passengers choosing high-speed rail is increased by 18.229%. In general, the proposed method reveals that the latent variables representing passenger's psychology has a significant impact on mode choice behavior, and the probability of choosing high-speed rail and civil aviation can be increased by improving the perceived level of safety of prevention measures, epidemic prevention strategies, and riding experience.
A Method for Evaluating Operation Efficiency of Bus Lines Based on a Bootstrap-DEA-Gini Model
YAN Xiu, LU Yu, XIE Qian, LIU Qiang, XIE Xiaomin
2023, 41(1): 161-168. doi: 10.3963/j.jssn.1674-4861.2023.01.017
Abstract(602) HTML (171) PDF(15)
Abstract:
Scientific evaluation of operation efficiency of urban bus lines is the premise of optimizing bus network and improving its level of service. An evaluation method is developed with the following indicators as the input: number of lines, line length, average station distance, non-linear coefficient, departure interval, operating speed, and ratio of the average fare to the average income. The outputs of the evaluation include the ratio of the daily average passenger flow to the number of residents served and the revenue per kilometer. Then, a data envelopment analysis (DEA) model is developed to evaluate the operation efficiency of bus lines. In order to correct the bias from the random factors in the case study with a small sample, the Bootstrap sampling method is used to expand the number of samples to in order to reproduce the overall distribution. In order to reduce the risk associated with the high dimensionality of the input indicators, Gini impurity is introduced to determine the weights of each subset of indicators and a combined value is calculated, in order to jointly improve the ability of the DEA model to differentiate the operation efficiency of different bus lines. At the same time, as it is difficult to determine the impact of different indicators by DEA, a partial least squares regression method is used to quantify the impact of each indicator on the operation efficiency of bus lines. Based on this, a Bootstrap-DEA-Gini model is proposed to evaluate the operation efficiency of 457 bus lines in the City of Foshan, Guangdong Province, China. Study results show that the average station distance, line length, and non-linear coefficients have a significant impact on the operation efficiency of bus lines, of which the average station distance has the highest impact ratio of up to 0.98. It is also found that the main reasons for the low operation efficiency of bus lines in the City of Foshan are long average departure interval, large non-linear coefficient, and small number of passenger seats. The operation efficiencies calculated based on the proposed Bootstrap-DEA-Gini model are lower than the traditional DEA model, and bus lines with similar operating efficiency can be effectively distinguished, which indicates that proposed method is effective for evaluating the efficiency of real-world bus operation.
A Method for Predicting Carbon Emission of Railway Transportation System Based on an LSTM Network with Dynamic Input via Sliding Window
ZHAO Xiaonan, XIE Xinlian, ZHAO Ruijia
2023, 41(1): 169-178. doi: 10.3963/j.jssn.1674-4861.2023.01.018
Abstract(583) HTML (175) PDF(56)
Abstract:
Low-carbon development of railway is significant for the entire transportation system to achieve the goals of carbon peaking and carbon neutrality. Currently, there are a few studies on the methods for predicting carbon emission of railway transportation system, and their prediction accuracy is, in general, low. To improve the accuracy of corresponding prediction methods, considering the relationship between the historical and present information in the carbon emission time series data, a sliding window algorithm is integrated into a long short-term memory (LSTM) network to develop a prediction model for railway transportation system. A Grey Relation Analysis method is used to select the key factors with a higher correlation. The data highly correlated with the key factors identified are used as the input variables of the prediction model to improve the accuracy of the LSTM network. In addition, it is found that, by integrating a sliding window, the input of the network has been significantly improved. To study the impacts of future emission reduction policies on carbon emissions of railway transportation, the prediction model is used to analyze various policies under different scenarios. A polynomial error fitting method is used for error correction to improve the model accuracy. The data on carbon emissions from railway transportation from 1980 to 2019 are taken as the case study. Six key factors are identified and then selected from seventeen influencing factors of railway carbon emission that are reported in the literature, by using a Grey Relation Analysis. Then selected data is segmented into subsequences by the sliding window. The prediction accuracy under different window lengths is compared to select the optimal window parameters for the improved LSTM model. The improved LSTM model obtained is then compared with the original LSTM, BPNN, and RNN models. Study results show that the improved LSTM model reduces the average relative error to 0.392%, while that of the original LSTM model is 3.862%, the BPNN model 1.535%, and the RNN model 0.760%. Compared to these traditional models, the improved LSTM model consistently presents a higher accuracy. According to historical trends and development policies, a baseline scenario and three future emission reduction scenarios are set. The improved LSTM model is used to predict the carbon emissions of railway transportation in the next decade. Under the four scenarios, the carbon emissions of railway transportation in 2030 is 9.83×10⁶ t, 8.91×10⁶ t, 8.62×10⁶ t, and 8.09×10⁶ t, respectively. In summary, the improved LSTM model with sliding window can further improve the prediction accuracy of carbon emissions for railway transportation, and the scenario analysis based on various policy assumptions can provide a feasible path for future low-carbon development of railway transportation.