

An Evaluation Model for Driver Takeover Performance Based on Multi-objective Indicators Representation
-
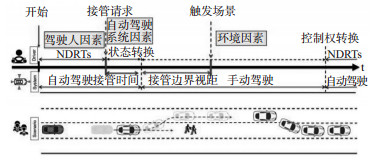
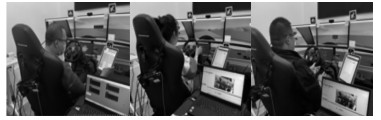
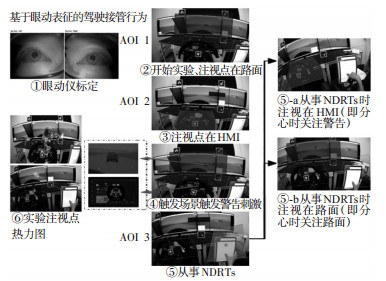
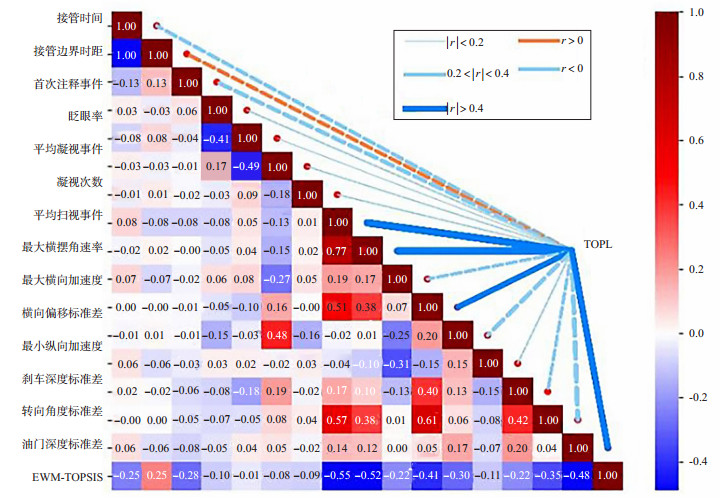
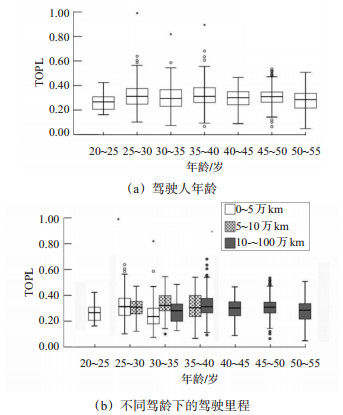
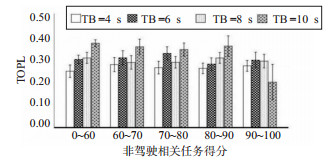
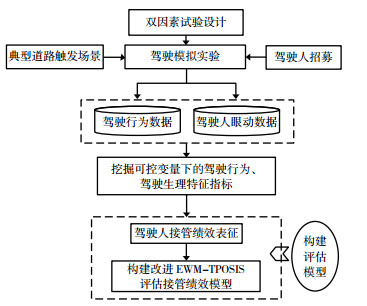
摘要: 驾驶人的接管绩效对于有条件自动驾驶车辆的安全性、驾乘体验与接受度具有重要意义。为了探究驾驶人行为对接管绩效的影响机理,提出1个代表接管绩效的综合评价表征指标——接管绩效水平(takeover performance level,TOPL),并构建基于改进EWM-TOPSIS的评估模型。该模型通过熵权法(entropy weight method,EWM)确定各指标客观权重,利用基于最优解偏好排序技术(technique for order preference by similarity to ideal solution,TOPSIS)模型中正负理想解对各指标进行编码映射。为了验证模型的有效性,招募46名驾驶人参与人机共驾接管实验,并提取表征驾驶人接管绩效安全性、舒适性和平稳性的多维度评价指标,深入探讨驾驶人在接管过程中执行的非驾驶相关任务,以及接管时间预算对驾驶人接管绩效水平的影响机理。进一步地,分析驾驶人年龄和标准型非驾驶相关任务完成绩效对TOPL的影响机理。研究结果表明:驾驶人年龄,非驾驶相关任务完成绩效对TOPL有显著影响,处于5万~10万km和0~5万km,10万~100万km之间的驾驶里程存在显著差异。车辆的最大横摆角速率、最大横向加速度,最大横向速度,油门深度标准差与TOPL之间存在显著的负相关关系,而接管边界时距与TOPL呈现显著的正相关关系。针对不同接管时间预算与非驾驶相关任务完成绩效,TOPL在接管时间预算为4 s时最低,接管程度紧急下的接管绩效水平较低。当驾驶人完成非驾驶相关任务低于60分时,TOPL最高,并且随着分数的增大TOPL有下降趋势。Abstract: The takeover performance of drivers is of great significance for the safety, driving experience, and acceptance of conditionally automated vehicles. To study the impacts of driver behavior on takeover performance, a comprehensive evaluation representation index, takeover performance level (TOPL), is proposed, and a model based on an improved EWM-TOPSIS method is constructed to evaluate TOPL. The model determines the objective weight of each index using the entropy weight method (EWM), and then codes and maps each index based on the positive and negative ideal solutions in the technique for order preference by similarity to ideal solution (TOPSIS) model, thereby constructing the TOPL evaluation model. To verify the effectiveness of the model, 46 drivers participated in a human-machine co-driving takeover experiment, from which multidimensional evaluation indicators representing the safety, comfort, and smoothness of driver takeover performance are extracted. The study examines non-driving-related tasks by drivers during takeover and the impacts of the lead time for takeover requests on the level of driver takeover performance. Furthermore, the study analyzed the significant impacts of driver age and standard non-driving-related task performance on TOPL. The results show that both driver age and non-driving-related task performance scores significantly impact TOPL. Additionally, significant differences in driver mileage are observed between the mileage ranges of 50 000 to 100 000 km, 0 to 50 000 km, and 100 000 to 1 000 000 km. A significant negative correlation exists among the maximum yaw rate, maximum lateral acceleration, maximum lateral velocity, throttle depth standard deviation, and TOPL, whereas the time to reach the takeover boundary is significantly positively correlated with TOPL. In relation to varying takeover time budgets and the performance in completing non-driving tasks, TOPL exhibited the minimum takeover time budget of 4 s, and its takeover performance level is observed to be lower under conditions of emergency takeover. Additionally, when the driver's score in non-driving task completion fell below 60, TOPL recorded the highest values, and the TOPL decreases as the score increases.
-

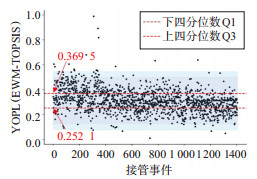
图 5 基于EWM-TOPSIS的TOPL判别结果
Figure 5. Discrimination results of TOPL based on EWM-TOPSIS

图 6 基于改进EWM-TOPSIS模型的指标相关性分析
Figure 6. Correlation analysis of indicators based on improved EWM-TOPSIS model

图 7 驾驶人年龄、驾驶里程与TOPL的显著性分析
Figure 7. Significance analysis of driver age, driving mileage, and TOPL

图 8 不同TB的NDRTs完成绩效与TOPL显著性分析
Figure 8. Significance analysis of performance in NDRTs、TB and TOPL

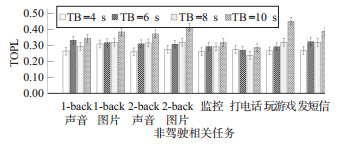
图 9 NDRTs与TB对TOPL显著性分析
Figure 9. Significant analysis of non-driving task performance on TOPL under different TB

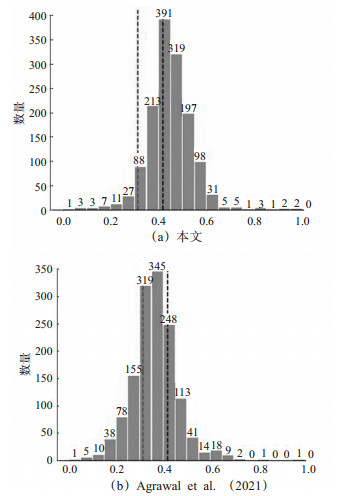
图 10 TOPL与TOPI(Agrawal et al.(2021))实验对比结果
Figure 10. Comparison of the proposed TOPL with the TOPI from Agrawal et al. (2021)
表 1 TOPL评价维度与指标
Table 1. Dimensions and indicators of TOPL evaluation
评价一级维度 评价二级维度 评价指标 变量符号 接管能力 接管时间/ s x1 接管边界时距/s x2 首次注视时间/s x3 安全性 平均眨眼率/% x4 风险感知能力 平均凝视时间/ ms x5 凝视次数/n x6 平均扫视时间/ ms x7 最大横摆角速率/(rad/s) x8 横向反应强度 最大横向速度/(m/s) x9 舒适性 最大横向加速度/(m/s2) x10 纵向反应强度 最大纵向速度/(m/s) x11 最小纵向加速度/(m/s2) x12 平稳性 接管质量 横向偏移标准差/m x13 刹车深度标准差/% x14 接管平滑性 转向角度标准差/() x15 油门深度标准差/% x16  下载: 导出CSV
表 2 基于熵权法赋权的各指标统计分析
Table 2. Statistical analysis of each index based on entropy weighting methodology
变量 均值 标准差 最大值 最小值 x1 2.902 0.844 9.406 0.128 x2 4.098 1.947 8.994 -2.151 x3 2.553 2.894 10 0.004 x4 7.084 6.214 51.446 0.028 x5 944.6 534.07 4 335.8 5.903 x6 47.88 32.98 430 1 x7 61.14 141.93 3 656.8 16 x8 17.68 10.305 79.352 0.042 x9 4.088 7.701 91.100 0.023 x10 0.469 0.2098 1.681 0.004 x11 80.65 3.904 87.41 54.096 x12 -0.821 0.190 -0.010 -1.6 899 x13 1.900 2.649 51.091 0.009 x14 409.54 1 390.44 42 209.6 0 x15 2 661.67 6 470.75 100 001 4.9E-32 x16 3 873.6 46 487.2 799 676.5 0
下载: 导出CSV
表 3 NDRTs完成绩效与TOPL显著性分析
Table 3. Significance analysis of performance in NDRTs and TOPL
M(P25,P75) Kruskal-Wallis检验统计量H值 p 分数 0~60(n=251) 60~70(n=99) 70~80(n=128) 80~90(n=133) 90~100(n=93) TOPL 0.333(0.3,0.4) 0.312(0.3,0.4) 0.312(0.3,0.4) 0.297(0.3,0.4) 0.294(0.2,0.3) 27.488 0.000** 注: n为统计总量产
下载: 导出CSV
表 4 标准型NDRTs与TOPL显著性分析
Table 4. Significance analysis of standard NDRTs and TOPL
M(P25,P75) Kruskal-Wallis检验统计量H值 p NDRTs back声音(n=176) 1-back图片(n=176) 2-back声音(n=176) 2-back图片(n=176) 监控(n=220) TOPL 0.300(0.2,0.4) 0.325(0.3,0.4) 0.312(0.3,0.4) 0.316(0.3,0.4) 0.297(0.2,0.3) 23.274 0.000** 注:n为统计总量。
下载: 导出CSV
-
[1] SAE International. Taxonomy and definitions for terms related to driving automation systems for on-road motor vehicles: SAE J3016[S]. Warrendale, PA, USA: SAE, 2021. [2] WEAVER B W, DELUCIA P R. A systematic review and meta-analysis of takeover performance during conditionally automated driving[J]. Human Factors, 2022, 64 (7) : 1227-1260. doi: 10.1177/0018720820976476 [3] DU N, ZHOU F, PULVER E M, et al. Predicting driver takeover performance in conditionally automated driving[J]. Accident Analysis & Prevention, 2020, 148: 105748. [4] AGRAWAL S, PEETA S. Evaluating the impacts of driver' s pre-warning cognitive state on takeover performance under conditional automation[J]. Transportation Research Part F: Traffic Psychology and Behaviour, 2021, 83: 80-98. doi: 10.1016/j.trf.2021.10.004 [5] WU C, WU H, LYU N, et al. Take-over performance and safety analysis under different scenarios and secondary tasks in conditionally automated driving[J]. IEEE Access, 2019(7) : 136924-136933. [6] XU L, GUO L, GE P, et al. Effect of multiple monitoring requests on vigilance and readiness by measuring eye movement and takeover performance[J]. Transportation Research Part F: Psychology and Behaviour, 2022, 91: 179-190. doi: 10.1016/j.trf.2022.10.001 [7] WU Y, ABDEL-ATY M, PARK J, et al. Effects of real-time warning systems on driving under fog conditions using an empirically supported speed choice modeling framework[J]. Transportation Research Part C: Emerging Technologies, 2018, 86: 97-110. doi: 10.1016/j.trc.2017.10.025 [8] AYOUB J, DU N, YANG X J, et al. Predicting driver takeover time in conditionally automated driving[J]. IEEE Transactions on Intelligent Transportation Systems, 2022, 23(7) : 9580-9589. doi: 10.1109/TITS.2022.3154329 [9] CAO Y, ZHOU F, PULVER E M, et al. Towards standardized metrics for measuring takeover performance in conditionally automated driving: a systematic review[C]. The Human Factors and Ergonomics Society Annual Meeting, Los Angeles: SAGE Publications, 2021. [10] WU H, WU C, LYU N, et al. Does a faster takeover necessarily mean it is better? A study on the influence of urgency and takeover-request lead time on takeover performance and safety[J]. Accident Analysis & Prevention, 2022, 171: 106647. [11] GOLD C, DAMBÖCK D, LORENZ L, et al. "Take over!" How long does it take to get the driver back into the loop?[C]. The Human Factors and Ergonomics Society Annual Meeting, 2013, 57 (1) : 1938-1942. [12] SHINAR D, TRACTINSKY N, COMPTON R. Effects of practice, age, and task demands, on interference from a phone task while driving[J]. Accident Analysis & Prevention, 2005, 37 (2) : 315-326. [13] KIM H J, YANG J H. Takeover requests in simulated partially autonomous vehicles considering human factors[J]. IEEE Transactionson Human-Machine Systems, 2017, 47 (5) : 735-740. doi: 10.1109/THMS.2017.2674998 [14] LI Q, WANG Z, WANG W, et al. An adaptive time budget adjustment strategy based on a takeover performance model for passive fatigue[J]. IEEE Transactions on Human-Machine Systems, 2021, 52 (5) : 1025-1035. [15] JAROSCH O, BENGLER K. Rating of takeover performance in conditionally automated driving using an expert-rating system[C]. Advances in Human Aspects of Transportation, Orlando, Florida, USA: AHFE, 2018. [16] NAUJOKS F, WIEDEMANN K, SCHÖMIG N, et al. Expert-based controllability assessment of control transitions from automated to manual driving[J]. MethodsX, 2018(5) : 579-592. [17] RADLMAYR J, RATTER M, FELDHÜTTER A, et al. Take-overs in level 3 automated driving-proposal of the takeover performance score(tops)[C]. 20th Congress of the International Ergonomics Association (IEA 2018), Florence, Italy: IEA, 2018. [18] LI Q, WANG Z, WANG W, et al. A human-centered comprehensive measure of takeover performance based on multiple objective metrics[J]. IEEE Transactions on Intelligent Transportation Systems, 2023, 24 (4) : 4235-4250. doi: 10.1109/TITS.2022.3233623 [19] DU N, YANG X J, ZHOU F. Psychophysiological responses to takeover requests in conditionally automated driving[J]. Accident Analysis & Prevention, 2020, 148: 105804. [20] LOUW T, KUO J, ROMANO R, et al. Engaging in NDRTs affects drivers' responses and glance patterns after silent automation failures[J]. Transportation Research Part F: Traffic Psychology and Behaviour, 2019, 62: 870-882. doi: 10.1016/j.trf.2019.03.020 [21] COHEN J. Statistical power analysis for the behavioral science. [J]. Technometrics 1988, 31 (4) : 499-500. [22] ERIKSSON A, STANTON N A. Takeover time in highly automated vehicles: noncritical transitions to and from manual control[J]. Human Factors: The Journal of the Human Factors and Ergonomics Society, 2017, 59 (4): 689-705. doi: 10.1177/0018720816685832 [23] WAN J, WU C. The effects of lead time of take-over request and nondriving tasks on taking-over control of automated vehicles[J]. IEEE Transactions on Human-Machine Systems, 2018: 582-591. [24] NAUJOKS F, HÖFLING S, PURUCKER C, et al. From partial and high automation to manual driving: Relationship between non-driving related tasks, drowsiness and takeover performance[J]. Accident Analysis & Prevention, 2018, 121: 28-42. [25] 王文军, 李清坤, 曾超, 等. 自动驾驶接管绩效的影响因素、模型与评价方法综述[J]. 中国公路学报, 2023, 36(9) : 202-224.WANG W J, LI Q K, ZENG C, et al. Reviewo tfakeover performance of automated D riving: influencing factors, models, and evaluation methods[J]. China Journal of Highway and Transport, 2023, 36 (9) : 202-224. (in Chinese) -

 点击查看大图
计量
- 文章访问数: 70
- HTML全文浏览量: 18
- PDF下载量: 13
- 被引次数: 0