



A Study on the Share Rate of High-capacity Public Transportation on the Airport Landside Based on Mixed Logit Model
-
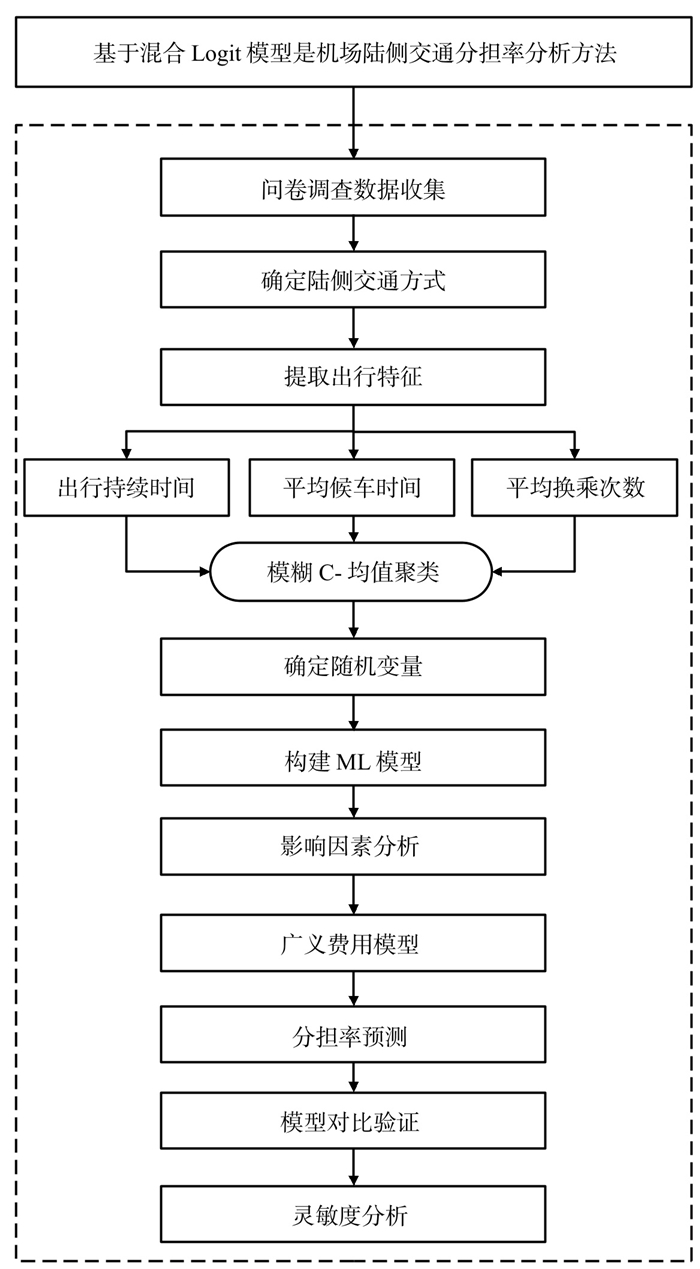
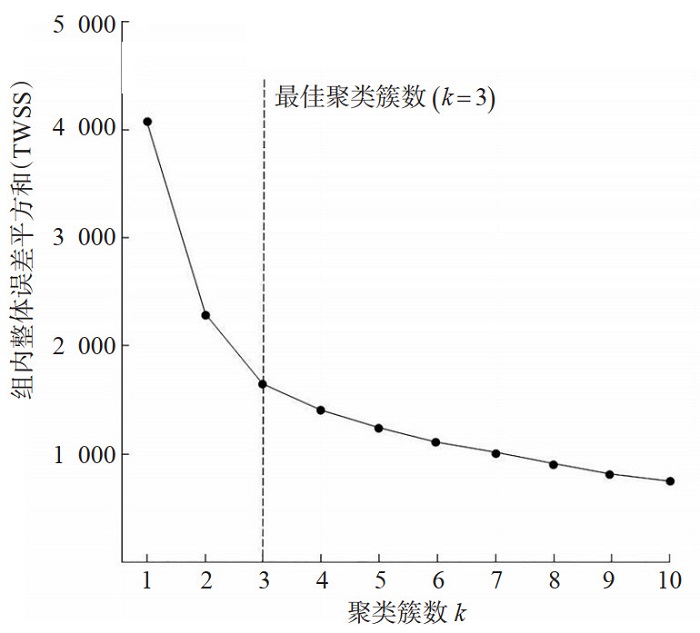
摘要: 科学预测机场陆侧大容量公共交通的分担比例,能够为陆侧交通设施规模和容量配置提供定量支撑,现有方法往往难以有效刻画出行者在时间价值、出行目的、换乘容忍度等方面的显著差异,预测结果存在偏平均、精度不足等问题。本研究在分析公共交通客流特征基础上,考虑出行者的个体异质性,研究了结合混合Logit模型(mixed logit,ML)与广义费用模型的公共交通分担率分析方法(mixed logit generalized cost,MLGC),采用模糊C-均值算法(fuzzy c-means,FCM),选择出行持续时间、平均换乘次数、平均候车时间为特征,基于肘部法则将陆侧出行者聚类为3类异质群体;以出行时间与出行费用为随机变量,将各参数按私人方式、轨道交通、机场巴士及空港巴士分为4类特定属性参数,对各自变量进行二元化分类处理,同时将换成走行感知、等待感知及拥挤环境等要素纳入广义费用函数,构建了包含空间语义的换乘阻抗系数。此外,建立三阶检验体系,依据赤池信息准则(Akaike information criterion,AIC)与对数似然值完成模型对比验证。以首都机场为实证对象,基于2 067份有效问卷完成模型标定,结果显示MLGC模型McFadden值达0.255,拟合系数R2为0.924,对数似然值与AIC值表现均优于其他模型。灵敏度分析表明,轨道交通发车间隔缩减70%时其分担率提升至26%,换乘走行时间缩减90%时公共交通整体分担率反超私人交通,适度下调票价可显著增强轨道交通竞争力。MLGC模型能有效揭示机场陆侧公共交通选择的影响机理,合理的发车间隔、优化的票价机制及便捷的换乘条件可显著提升公共交通分担率。Abstract: Scientifically predicting the share rate of high-capacity public transportation on the airport landside can provide quantitative support for the scale and capacity allocation of landside transportation facilities. Existing methods often have difficulty effectively depicting the significant differences in factors such as travel time value, travel purpose, and tolerance for transfers among travelers. Prediction results usually have issues such as being biased towards the average and lacking accuracy. Based on the analysis of the characteristics of public transportation passenger flow, this study takes into account the individual heterogeneity of travelers and develops a mixed logit generalized cost (MLGC) method for public transportation share rate by combining the mixed logit (ML) model with the generalized cost model. The fuzzy c-means (FCM) algorithm is used to select travel duration, average transfer times, and average waiting time as features. Based on the elbow rule, landside travelers are clustered into three heterogeneous groups. Taking travel time and travel cost as random variables, the parameters are classified into 4 specific attribute parameters according to private mode, rail transit, airport bus, and airport shuttle bus. Each variable is processed for binary classification. Meanwhile, elements such as perception of travel, waiting perception, and crowded environment are incorporated into the generalized cost function to construct a transfer impedance coefficient that includes spatial semantics. In addition, a three-level testing system was established, and model comparison and verification were carried out based on the Akaike information criterion (AIC) and log-likelihood values. Taking the Capital Airport as the empirical object, the model is calibrated using 2 067 valid questionnaires. The results showed that the McFadden value of the MLGC model reached 0.255, the fitting coefficient R2 is 0.924, and the log-likelihood value and AIC perform better than others. Sensitivity analysis indicates that when the train interval is reduced by 70%, the share rate increases to 26%, and when the transfer travel time is reduced by 90%, the overall share rate of public transportation exceeds private transportation. Moderately lowering ticket prices could significantly enhance the competitiveness of rail transit. The MLGC model can effectively reveal the influencing mechanism of the impact of airport landside public transportation choices. Reasonable train intervals, optimized ticket pricing mechanisms, and convenient transfer conditions can significantly increase the share rate of public transportation.
-
Key words:
- air transportation /
- public transportation /
- sharing rate /
- ML model /
- generalized cost
-

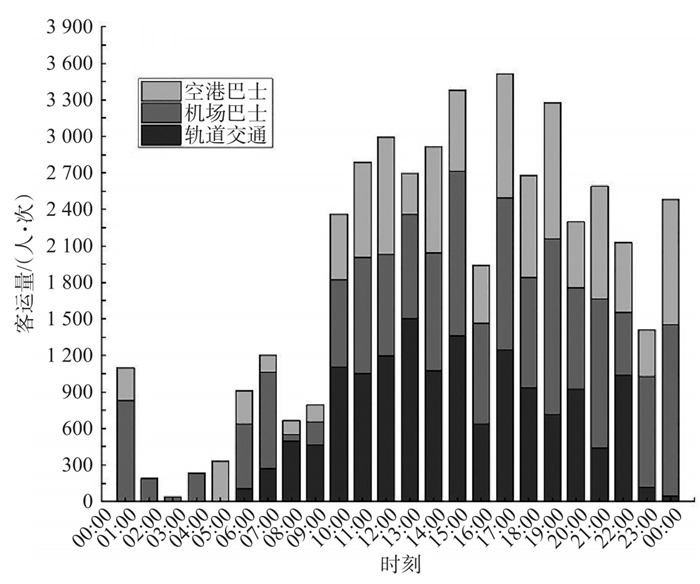
图 2 9月份工作日公共交通客流量的分时平均值
Figure 2. Time-share averages of weekday public transport ridership in September

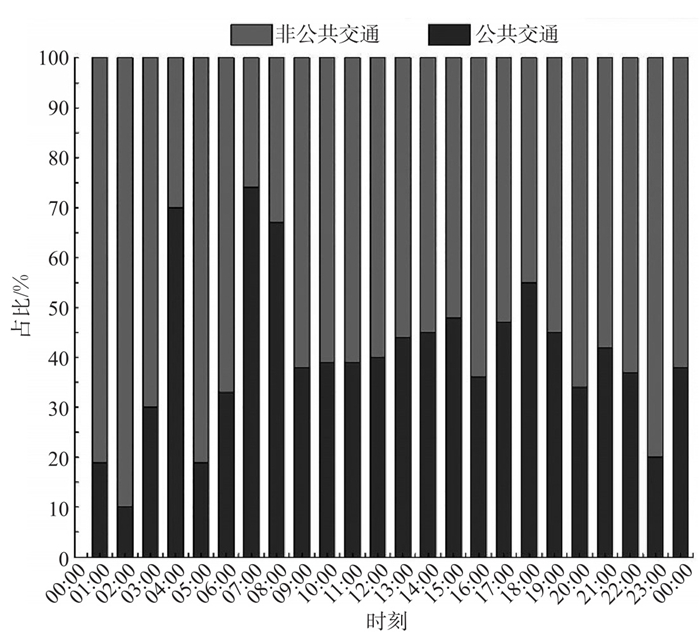
图 3 9月份工作日各时刻的公共交通与非公共交通客流分时平均占比
Figure 3. The average share of public transport and non-public transport passenger flow at each time of the working day in September

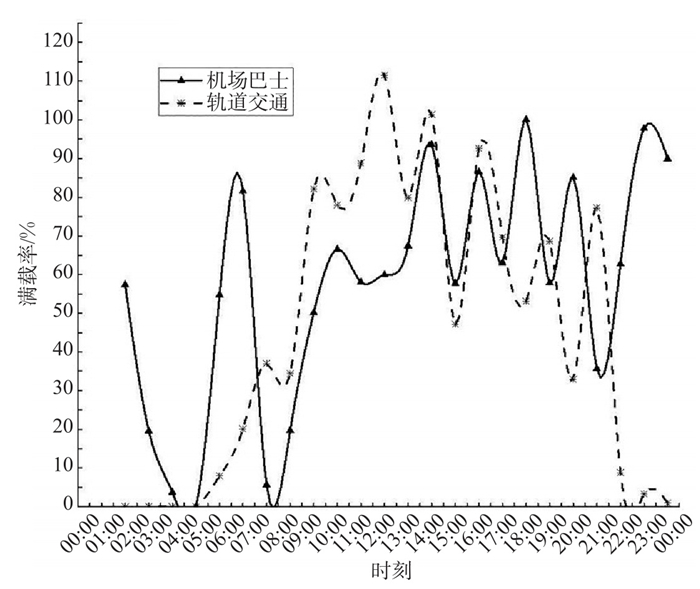
图 4 9月份工作日轨道交通与机场巴士分时满载率均值
Figure 4. Average load ratio of rail transit and airport bus on weekdays in September

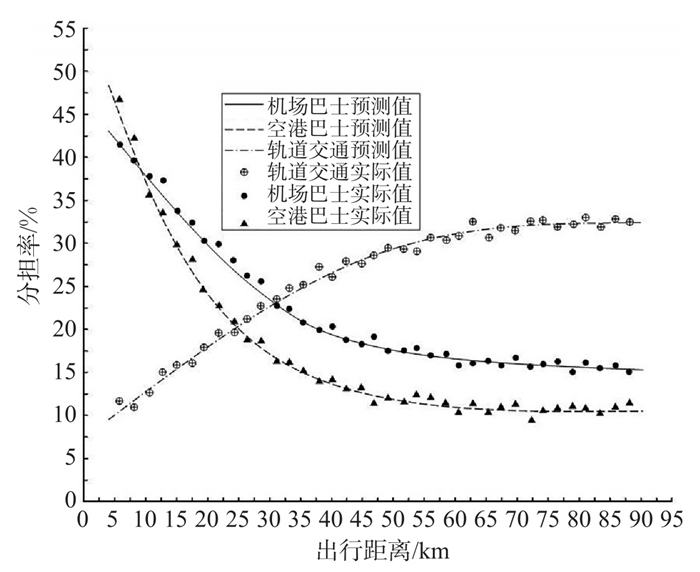
图 7 机场陆侧公共交通分担率实际值与预测值
Figure 7. Actual and predicted value of public traffic sharing rate on the airport landside

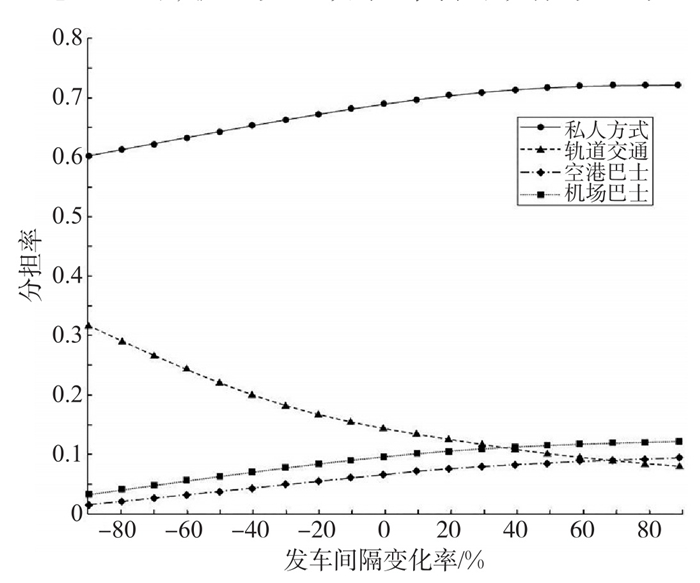
图 9 发车间隔变化率对分担率的影响
Figure 9. The influence of the departure interval change rate on the sharing rate

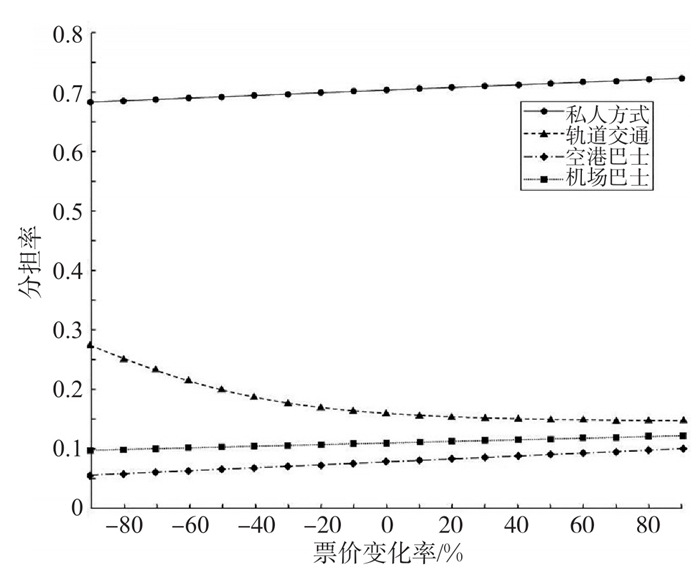
图 10 轨道交通票价变化率对分担率的影响
Figure 10. The impact of rail transit fare change rate on sharing rate

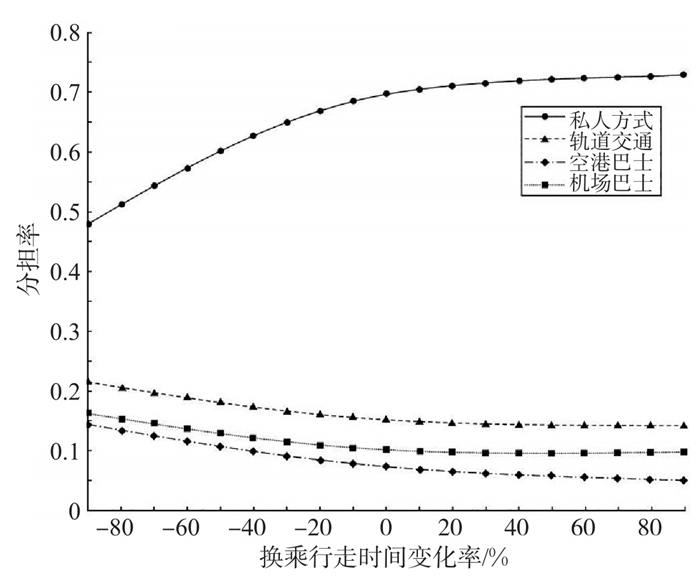
图 11 换乘走行时间变化率对分担率的影响
Figure 11. Influence of the change rate of transfer travel time on the sharing rate

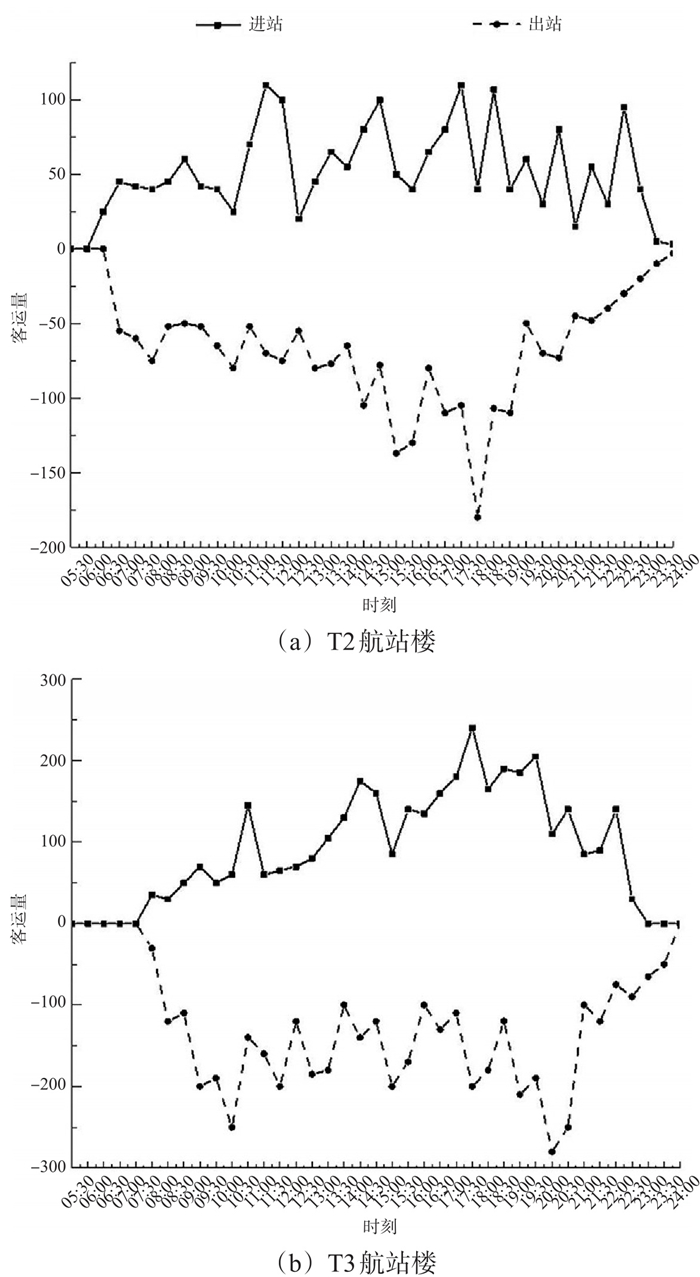
图 12 航站楼轨道机场线进出站客流量特征
Figure 12. Passenger flow characteristics of the terminal rail-airport line in and out of the station
表 1 模型变量设置说明
Table 1. Model variable setting description
影响因素 变量 说明 个人属性 性别 Gen 0:男性; 1:女性 年龄/岁 Age 0:≤18;1: > 18~30;2: > 30~55;3: > 55 教育水平 Edu 0:高中及以下; 1:大学本科; 2:研究生 职业 Occ 0:学生; 1:企事业单位员工; 2:其他 个人月收入/元 Inc 0:≤3000;1: > 3000~8000;2: > 8000 家庭属性 驾照 Lic 0:有驾照; 1:无驾照 小汽车数量/辆 Car 0:无小汽车; 1:1;2: > 1 家庭月收入/元 Hinc 0:≤5000;1: > 5000~10000;2: > 10000 出行属性 出行目的 Purp 0:公务出行; 1:探亲访友; 2:回家回程; 3:其他 出行时间/min Time 出发时间与到达时间之差 换乘次数/次 Tran 0:≤1;1: > 1~2;2: > 2 换乘时间/min Trat 0:≤10;1: > 10~15;2: > 15 出行费用/元 Cost 0:≤5;1: > 5~15;2: > 15  下载: 导出CSV
表 2 机场陆侧公共交通方式选择回归结果
Table 2. Regression results of airport landside public transportation mode selection
变量 轨道交通 机场巴士 空港巴士 CCoeff P CCoeff P CCoeff P 个人属性 Gen_0 -0.774 0.177 -1.203 0.201 -3.792 0.109 Gen_1 2.021* 0.029 1.183* 0.047 2.127 0.094 Age_0 -2.112 0.163 -0.446 0.204 -0.223 0.078 Age_1 1.207** 0.009 0.119 0.058 -1.201 0.103 Age_2 0.031 0.068 2.361* 0.022 1.322* 0.014 Age_3 -3.037 0.097 0.104 0.078 1.228 0.082 Edu_0 -1.230 0.112 -2.032 0.086 -0.808 0.052 Edu_1 -0.832 0.098 -4.661 0.114 -1.297 0.095 Edu_2 -2.164 0.077 -1.083 0.091 1.325 0.060 Occ_0 2.275*** 3.293* 0.043 1.473 0.058 Occ_1 -0.290 0.124 -1.904 0.087 -1.203 0.063 Occ_2 1.309 0.102 2.432 0.052 2.429 0.057 Inc_0 1.067*** 0.511*** 0.915*** Inc_1 3.002* 0.048 -0.062** 0.007 -0.291* 0.017 Inc_2 -2.054*** -2.929*** -1.022*** 家庭属性 Lic_0 -0.823** 0.005 -1.037* 0.013 -2.112* 0.022 Lic_1 -2.545 0.071 -2.990 0.085 -0.993 0.089 Car_0 0.884 0.066 1.324 0.090 2.576 0.075 Car_1 -1.441* 0.016 -0.278* 0.024 -3.208** 0.008 Car_2 -2.709*** -1.389*** -1.524*** Hinc_0 0.632** 0.003 2.120* 0.012 0.582* 0.037 Hinc_1 -2.692 0.059 1.504 0.086 3.038 0.063 Hinc_2 -1.614* 0.033 -0.283*** -1.027 0.057 Purp_0 -0.028*** -1.238*** -2.302*** Purp_1 -3.772 0.091 1.493 0.078 -0.945 0.087 Purp_2 0.283* 0.047 2.274* 0.025 0.206 0.058 Time -1.482 0.089 -0.072 0.112 -0.391 0.093 出行属性 Tran_0 1.062*** -0.188 0.066 -1.376 0.152 Tran_1 0.386*** -1.282* 0.014 -0.283* 0.047 Tran_2 -2.205 0.125 1.102 0.088 1.294 0.074 Trat_0 1.017*** -2.114* 0.055 -0.275* 0.032 Trat_1 0.028*** -1.203* 0.039 -3.216* 0.044 Trat_2 -1.421 0.057 0.226 0.066 0.025 0.141 Cost_0 -2.037*** 2.990*** 1.928*** Cost_1 2.009*** -1.021*** -1.234*** 模型统计 Cost_2 0.484 0.077 -2.473 0.053 2.007 0.095 Constant 14.201 0.188 11.002 0.201 4.995 0.142 McFadden=0.255 Chi2=465.78 Prob > Chi2=0.000
L(0)=-912.27 L(θ)=-679.38 Sample size=2067注:“*”代表p≤0.05;“**”代表p≤0.01;“***”代表p < 0.001。
下载: 导出CSV
表 3 广义费用模型参数取值
Table 3. Generalized cost model parameter values
参数 轨道交通(k=1) 机场巴士(k=2) 空港巴士(k=3) Uk/元 25 25 5 mk/元 0 0.5 0.5 vk/(km/h) 40 25 25 δk/次 1.44 0.63 0.48 $ T_{\text{out}}^{k} $/min 21.33 15.52 13.09 twalk/min 13.77 10.36 11.21 $ T_{\text{wait}}^{1} $/min 3.81 5.79 6.12 Qwalk(人/h) 3.5×10³ 5×10³ 4.5×10³ Qwait(人/h) 3.5×10³ 5×10³ 4.5×10³ φ 1 1 1 τ 0 0 0 η 1 1 1
下载: 导出CSV
表 4 基本出行特征及样本隶属度
Table 4. Basic travel characteristics and sample membership
出行特征 出行者I 出行者II 出行者III 出行持续时间/min 40 60 90 平均换乘次数/次 ≤1 > 1~2 > 2 平均候车时间/min ≤5 > 5~15 > 15 平均隶属度/% 91.44 89.20 91.38 样本个数 677 704 686
下载: 导出CSV
表 5 模型参数估计结果(MNL)
Table 5. Model parameter comparison estimation results (MNL)
解释变量 出行者Ⅰ 出行者Ⅱ 出行者Ⅲ CCoeff P CCoeff P CCoeff P 常数 1.019 0.124 -1.223 0.057 -1.370 0.071 个人月收入 > 3000元 0.227* 0.039 -0.438 0.054 -0.983* 0.035 小汽车数量≥1 1.230* 0.021 -2.035 0.134 -2.303* 0.033 在车时间 -2.291 0.053 -0.093 0.069 0.720 0.075 接驳时间 -0.737 0.084 -1.204 0.082 1.554* 0.018 出行舒适性 0.302** 0.002 -1.037* 0.011 -1.803 0.089 出行可靠性 0.054*** 0.721* 0.043 -0.395 0.104 出行便捷性 0.889* 0.038 0.392 0.062 -0.067* 0.027 出行经济性 -1.293 0.067 1.335 0.077 1.906* 0.011 模型拟合信息 对数似然(绝对值) 4 933.9 AIC 10 411.82 注:“*”代表p≤0.05;“**”代表p≤0.01;“***”代表p < 0.001。
下载: 导出CSV
表 6 模型参数对比估计结果(NL)
Table 6. Model parameter comparison estimation results (NL)
解释变量 出行者Ⅰ 出行者Ⅱ 出行者Ⅲ CCoeff P CCoeff P CCoeff P 常数 1.993 0.089 -0.239 0.051 -0.283 0.052 个人月收入 > 3000元 0.271* 0.012 -1.284 0.096 -1.462** 0.001 小汽车数量≥1 0.128* 0.037 -2.882 0.058 -1.091** 0.003 在车时间 -0.085 0.083 -0.039 0.091 0.887 0.072 接驳时间 -0.203 0.118 -0.621 0.085 1.028* 0.037 出行舒适性 2.336* 0.043 -1.482** 0.004 -1.536 0.093 出行可靠性 1.304*** 1.338*** -0.304 0.054 出行便捷性 2.392** 0.008 0.923 0.070 -0.409* 0.038 出行经济性 -0.097 0.103 2.201 0.084 1.308*** 模型拟合信息 对数似然(绝对值) 4904.1 AIC 10398.09 注:“*”代表p≤0.05;“**”代表p≤0.01;“***”代表p < 0.001。
下载: 导出CSV
表 7 模型参数对比估计结果(MLGC)
Table 7. Model parameter comparison estimation results (MLGC)
解释变量 出行者Ⅰ 出行者Ⅱ 出行者Ⅲ CCoeff P CCoeff P CCoeff P 常数 1.347 0.117 -0.329 0.073 -2.337 0.083 个人月收入 > 3000元 1.203** 0.009 -1.093 0.080 -0.739* 0.025 小汽车数量≥1 1.556* 0.044 -1.392 0.057 -1.809* 0.042 在车时间 -0.278 0.051 -1.801 0.071 1.032 0.051 接驳时间 -0.391 0.103 -2.002 0.066 0.843* 0.023 出行舒适性 0.213* 0.026 -0.304** 0.008 -0.927 0.058 出行可靠性 2.394** 0.006 0.521*** -1.206 0.061 出行便捷性 1.029*** 0.393*** -1.335* 0.033 出行经济性 -0.072 0.079 1.377 0.057 0.331*** 模型拟合信息 对数似然(绝对值) 4889.74 AIC 10373.63 注:“*”代表p≤0.05;“**”代表p≤0.01;“***”代表p < 0.001。
下载: 导出CSV
表 8 观测变量表征情况
Table 8. The observed variable characterizes the situation
潜变量 观测变量 舒适性 车内座椅较为舒适, 乘坐过程中无需站立 无需排队, 车内空气较清新, 乘坐体验较好 便捷性 无需换乘, 可直达目的地 采用地铁或公共交通方式进行换乘即可达到最终目的地 可靠性 不存在堵车或出行延误情况 出行时间可把控, 准时程度较高 经济性 整体票价设置较为合理 采用该方式的总体出行费用较低
下载: 导出CSV
-
[1] 路尧. 大型机场旅客城市空间分布预测与交通方式选择行为研究[D]. 北京: 北京工业大学, 2019.LU Y. Research on spatial distribution prediction and ground access mode choice of large airports in cites[D]. Beijing: Beijing University Of Technology, 2019. (in Chinese) [2] 苏国威. 机场航站楼到达层地面交通换乘效率评价及优化研究[D]. 桂林: 桂林电子科技大学, 2023.SU G W. Research on evaluation and optimization of ground traffic transfer efficiency on arrival floor of airport terminal[D]. Guilin: Guilin University of Electronic Technology, 2023. (in Chinese) [3] GHADER S, CARRION C, TANG L, et al. A copula-based continuous cross-nested logit model for tour scheduling in activity-based travel demand models[J]. Transportation Research Part B: Methodological, 2021, 145: 324-341. doi: 10.1016/j.trb.2021.01.001 [4] 罗红双, 张杰. 大型空港综合客运枢纽陆侧交通规划布局研究综述[J]. 交通运输工程与信息学报, 2018, 16(4): 93-100.LUO H S, ZHANG J. Review of planning and layout of large airport integrated passenger hub landside traffic[J]. Journal of Transportation Engineering and Information, 2018, 16(4): 93-100. (in Chinese) [5] 罗谦, 李琦, 文涛, 等. 机场到港旅客换乘时间效率评价指标优选[J]. 北京航空航天大学学报, 2022, 48(12): 1-9.LUO Q, LI Q, WEN T, et al. Optimization of transfer time efficiency evaluation index for airport arriving passengers[J]. Journal of Beijing University of Aeronautics and Astronautics, 2022, 48(12): 1-9. (in Chinese) [6] 边扬, 贾大智, 冯笑凡, 等. 北京大兴国际机场陆侧交通客流特征研究[J]. 城市交通, 2022, 20(4): 63-69.BIAN Y, JIA D Z, FENG X F, et al. Characteristics of landside passenger flow of Beijing Daxing international airport[J]. Urban Transport of China, 2022, 20(4): 63-69. (in Chinese) [7] TAM M L, LAM W H K, LO H P. The impact of travel time reliability and perceived service quality on airport ground access mode choice[J]. Journal of Choice Modelling, 2011(4): 49-69. [8] MAMDOOHI A R, SAFFARZADE M, TAHERPOUR A, et al. Modeling air passengers'ground access mode choice: a case study of IKIA[J]. International Journal of Modeling and Optimization, 2012, (2): 147-152. [9] HARVEY G. Study of airport access mode choice[J]. Journal of Transportation Engineering, 1986, 112: 525-545. doi: 10.1061/(ASCE)0733-947X(1986)112:5(525) [10] 王爱云. 机场轨道交通客流预测问题研究[D]. 西安: 长安大学, 2014.WANG A Y. Study on passenger volume forecasting of airport rail transit[D]. Xi'an: Chang'an University, 2014. (in Chinese) [11] 郭桐君. 轨道交通机场线规划方案对机场陆侧交通分担率的影响研究[D]. 北京: 北京交通大学, 2020.GUO T J. Impact of rail transit airport line planning scheme on airport ground access modal share[D]. Beijing: Beijing Jiaotong University, 2020. (in Chinese). [12] 葛红景. 机场陆侧交通一体化发展水平评价研究[D]. 南宁: 广西大学, 2023.GE H J. Study on evaluation of the development level for airport landside transportation[D]. Nanning: Guangxi University, 2023. (in Chinese) [13] ZAIDAN E, ABULIBDEH A. Modeling ground access mode choice behavior for Hamad international airport in the 2022 FIFA World Cup city, Doha, Qatar[J]. Journal of Air Transport Management, 2018, 73: 32-45. [14] LURKIN V, GARROW L A, HIGGINS M J, et al. Accounting for price endogeneity in airline itinerary choice models: an application to continental U. S. markets[J]. Transportation Research Part A: Policy and Practice, 2017, 100: 228-246. doi: 10.1016/j.tra.2017.04.007 [15] MURAKAMI J, MATSUI Y, KATO H. Airport rail links and economic productivity: evidence from 82 cities with the world's 100 busiest airports[J]. Transport Policy, 2016, 52: 89-99. doi: 10.1016/j.tranpol.2016.07.009 [16] FU J, LIN H, NIU Y, et al. Share ratio change of public transport in airport landside under the background of car population rapid increase: a case of Shanghai Pudong international airport[J]. Transportation Research Procedia, 2017, 25: 92-102. doi: 10.1016/j.trpro.2017.05.384 [17] 周悦, 江欣国, 付川云, 等. 基于混合Logit模型的出租车超速者运营因素分析[J]. 交通运输系统工程与信息, 2021, 21 (3): 229-236.ZHOU Y, JIANG X G, FU C Y, et al. Operational factors analysis for taxi speeders using mixed logit model[J]. Journal of Transportation Systems Engineering and Information Technology, 2021, 21(3): 229-236. (in Chinese) [18] 朱宇婷, 戎亚萍, 赵欣苗. 换乘效率对城市轨道交通分担率的影响研究[J]. 交通运输系统工程与信息, 2017, 17(2): 35-40.ZHU Y T, RONG Y P, ZHAO X M. Impact of transfer efficiency on the market share of urban rail transit[J]. Journal of Transportation Systems Engineering and Information Technology, 2017, 17(2): 35-40. (in Chinese) [19] 李颖, 赵莉, 赵祥模, 等. 基于大货车GPS数据的轨迹相似性度量有效性研究[J]. 中国公路学报, 2020, 33(2): 146-157.LI Y, ZHAO L, ZHAO X M, et al. Effectiveness of trajectory similarity measures based on truck GPS data[J]. China Journal of Highway Transportation, 2020, 33(2): 146-157. [20] 欧阳杰, 孙铭扬, 朱长青, 等. 大型枢纽机场航站楼港湾区运行程序优化方法[J]. 交通信息与安全, 2025, 43(2): 109-118. doi: 10.3963/j.jssn.1674-4861.2025.02.012OUYANG J, SUN M Y, ZHU C Q, et al. A study on optimization of operation procedures in the cul-de-sac area of terminals in large hub airports [J]. Journal of Transport Information and Safety, 2025, 43(2): 109-118. (in Chinese) doi: 10.3963/j.jssn.1674-4861.2025.02.012 [21] 张姚, 曹振宇. 考虑换乘站点时间权重的公交时刻表优化[J]. 交通运输工程与信息学报, 2020, 18(1): 77-82.ZHANG Y, CAO Z Y. Optimization model for public transport timetable with the time weight of transfer station[J]. Journal of Transportation Engineering and Information, 2020, 18(1): 77-82. (in Chinese) [22] ALHUSSEIN S N. Analysis of ground access modes choice King Khaled international airport, Riyadh, Saudi Arabia[J]. Journal of Transport Geography, 2011, 19: 1361-1367 doi: 10.1016/j.jtrangeo.2011.07.007 [23] 程小慷, 曹誉丹, 崔宇婕. 基于改进PSO的离港航班绿色滑行路径优化[J]. 航空计算技术, 2023, 53(3): 25-29.CHENG X K, CAO Y D, CUI Y J. Green taxi path optimization of departing flights based on improved PSO algorithm[J]. Aeronautical Computing Technique, 2023, 53(3): 25-29. (in Chinese) -

 点击查看大图
计量
- 文章访问数: 45
- HTML全文浏览量: 15
- PDF下载量: 6
- 被引次数: 0