



Navigation Status Control of Cargo Ships in the Three Gorges Dam-Gezhouba Dam Cascade Navigation Hubs
-
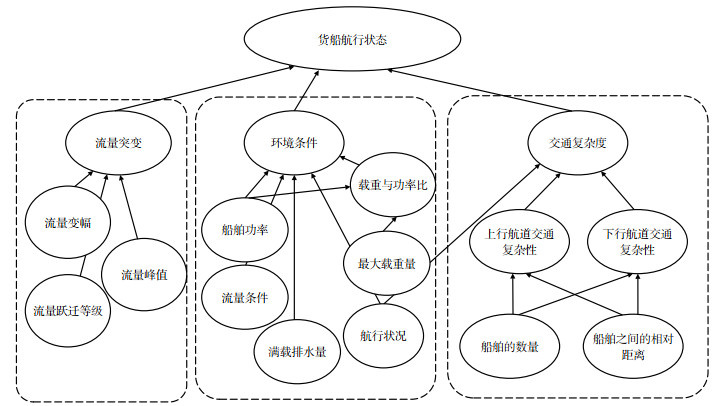
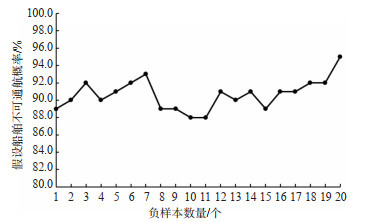
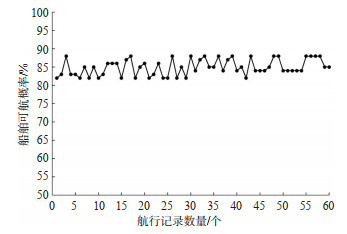
摘要: 针对三峡-葛洲坝梯级通航枢纽两坝间水域在汛期流量剧烈变化条件下货船通航风险较大的问题,本研究提出基于贝叶斯网络的货船航行状态控制模型,用于识别不满足通航条件的货船并评估其许可通航概率。模型结构结合两坝间水域通航特征,设置了环境条件、流量突变及交通复杂度3个模块,并构建了船舶属性与航道流量变化耦合的影响因素体系。在流量突变模块中,针对汛期流量变化特征,利用流量峰值、流量变幅及跃迁等级指标对突变等级进行评估。交通复杂度模块结合该水域上下行分道通航特点,以5小时通航周期为分析窗口,设置船舶数量分级和船舶间距分级指标,用以表征航道交通状态。针对模型节点参数难以直接获取的问题,本研究结合《三峡—葛洲坝水利枢纽两坝间航道汛期流量标准》、问卷调查结果及IF-THEN规则确定节点条件概率表。在此基础上,通过贝叶斯网络推理计算货船许可通航概率,形成面向通航准入的航行状态控制模型。模型验证采用实船数据、违规负样本及过坝数据进行,同时通过敏感性分析识别关键影响因素。验证结果显示:5组实船数据的许可通航概率均大于80%,与实际航行记录一致;违规负样本的不可航概率为88%~95%,能够有效识别高风险工况;60组过坝数据的许可通航概率为82%~88%,平均值为85%,与实际运行情况吻合。敏感性分析结果表明,流量条件和船舶功率为影响货船航行状态控制的主要因素。Abstract: This study addresses the high navigation risk of cargo ships caused by the drastic flood-season flow changes between the Three Gorges and Gezhouba navigation hubs. A navigation state control model for cargo ships based on a Bayesian network is developed to identify ships that fail to meet navigation conditions and to evaluate their permissible navigation probability. The model structure is designed according to the waterway's navigation characteristics and includes three modules: environmental conditions, flow mutation, and traffic complexity. An influencing factor system couples ship attributes with channel flow variations. The flow mutation module evaluates mutation grades using flow peak, variation amplitude, and transition grade to represent flood-season flow changes.The traffic complexity module considers separate upstream and downstream navigation, using a five-hour analysis window, and graded indexes of ship quantity and spacing to characterize channel traffic state. Node conditional probability tables are determined using the Flood Season Navigation Flow Standard, survey results, and IF-THEN rules to address difficulty in directly obtaining model parameters. The Bayesian network calculates permissible navigation probabilities, forming a navigation state control framework for navigation access. Verification with five actual ship samples, multiple noncompliant samples, and sixty dam-passing records shows that all five actual ship samples have permissible navigation probabilities above 80%, consistent with observed operations. Noncompliant samples have non-navigation probabilities of 88%~95%, identifying high-risk conditions. Sixty dam-passing records show permissible navigation probabilities of 82%~88%, averaging 85%, consistent with operational records. Sensitivity analysis identifies flow conditions and ship power as the main factors influencing cargo ship navigation state control.
-
Key words:
- Navigation safety /
- Safety management /
- Probability estimation /
- Bayesian network
-

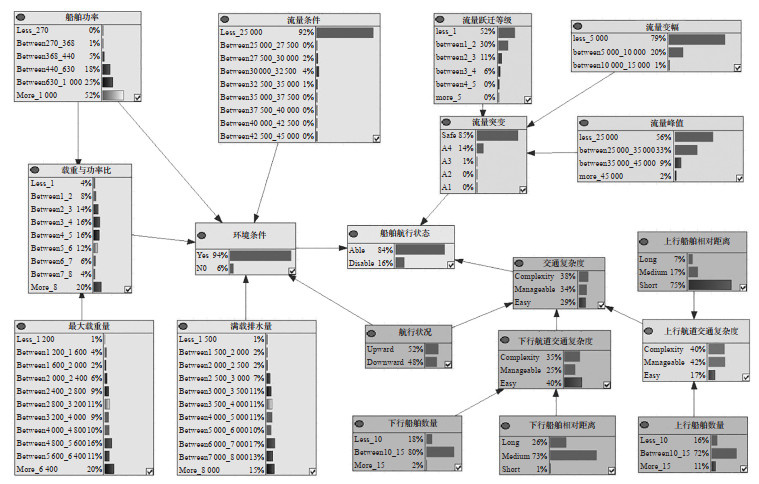
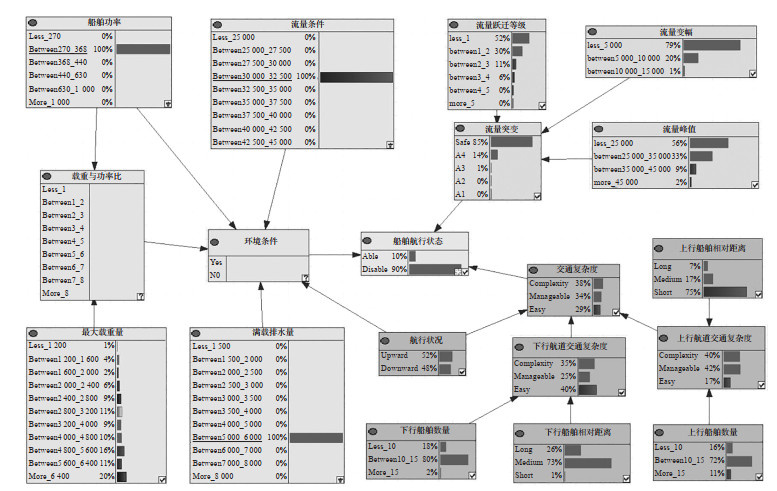
图 3 基于贝叶斯网络的货船航行状态控制模型初始情景
Figure 3. The initial scenario of the cargo ship navigation state control model based on Bayesian network

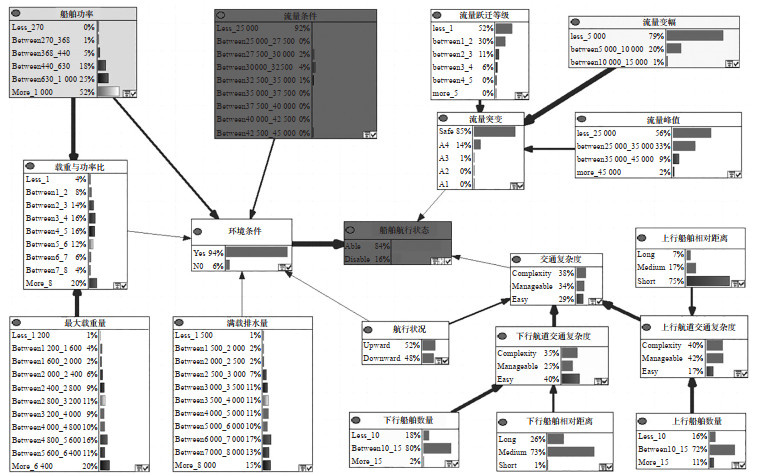
图 4 货船航行状态控制模型的敏感性分析
Figure 4. Sensitivity analysis of cargo ship navigation state control model
表 1 货船航行控制状态模型的影响因素及状态
Table 1. Influencing factors and states of the navigation control status model for cargo ships.
影响因素 状态 环境条件 良好、不良 最大载重量/t > 0~1200、 > 1200~1600、 > 1600~2000、 > 2000~2400、 > 2400~2800、 > 2800~3200、 > 3200~4000、 > 4000~4800、 > 4800~5600、 > 5600~6400、 > 6400 满载排水量/t > 0~1500、 > 1500~2000、 > 2000~2500、 > 2500~3000、 > 3000~3500、 > 3500~4000、 > 4000~5000、 > 5000~6000、 > 6000~7000、 > 7000~8000、 > 8000 流量/(m3/s) > 0~25000、 > 25000~27500、 > 27500~30000、 > 30000~32500、 > 32500~35000、 > 35000~37500、 > 37500~40000、 > 40000~42500、 > 42500~45000 船舶功率/kW > 0~270、 > 270~368、 > 368~440、 > 440~630、 > 630~1000、 > 1000 载重与功率比 > 0~1、 > 1~2、 > 2~3、 > 3~4、 > 4~5、 > 5~6、 > 6~7、 > 7~8、 > 8 船舶航行状态 上行、下行 交通复杂度 复杂、可控、简单 上行航道复杂度 复杂、可控、简单 下行航道复杂度 复杂、可控、简单 下行船舶数量/艘 > 0~10、 > 10~15、 > 15 下行船舶间距/(n mile) > 0~3、 > 3~6、 > 6 上行船舶数量/艘 > 0~10、 > 10~15、 > 15 上行船舶间距/(n mile) > 0~3、 > 3~6、 > 6 流量突变 无预警、Ⅳ级预警、Ⅲ级预警、Ⅱ级预警、Ⅰ级预警 流量跃迁等级 > 0~1、 > 1~2、 > 2~3、 > 3~4、 > 4~5、 > 5 流量峰值/(m3/s) > 0~25000、 > 25000~35000、 > 35000~45000、 > 45000 流量变幅/(m3/s) > 0~5000、 > 5000~10000、 > 10000~15000  下载: 导出CSV
表 2 环境条件模块根节点的先验概率
Table 2. The prior probability of the root node of the environmental condition module
节点 最大载重量/t 满载排水量/t 流量/(m3/s) 船舶功率/kW 状态 先验概率 状态 先验概率 状态 先验概率 状态 先验概率 1 > 0~1200 0.013 > 0~1500 0.007 > 0~25000 0.917 > 0~270 0.001 2 > 1200~1600 0.040 > 1500~2000 0.023 > 25000~27500 0.003 > 270~368 0.012 3 > 1600~2000 0.024 > 2000~2500 0.018 > 27500~30000 0.022 > 368~440 0.050 4 > 2000~2400 0.058 > 2500~3000 0.067 > 30000~32500 0.041 > 440~630 0.176 5 > 2400~2800 0.089 > 3000~3500 0.107 > 32500~35000 0.013 > 630~1000 0.246 6 > 2800~3200 0.114 > 3500~4000 0.112 > 35000~37500 0.001 > 1000 0.515 7 > 3200~4000 0.094 > 4000~5000 0.113 > 37500~40000 0.001 8 > 4000~4800 0.102 > 5000~6000 0.105 > 40000~42500 0.001 9 > 4800~5600 0.155 > 6000~7000 0.169 > 42500~45000 0.001 10 > 5600~6400 0.106 > 7000~8000 0.128 11 > 6400 0.205 > 8000 0.151
下载: 导出CSV
表 3 交通复杂度模块根节点的先验概率
Table 3. The prior probability of the root node of the traffic complexity module
节点 1 2 3 4 5 6 流量跃迁等级 > 0~1 > 1~2 > 2~3 > 3~4 > 4~5 > 5 0.522 0.304 0.109 0.063 0.001 0.001 流量峰值/(m3/s) > 0~25 000 > 25 000~35 000 > 35 000~45 000 > 45 000 0.561 0.332 0.089 0.018 流量变幅/(m3/s) > 0~5 000 > 5 000~10 000 > 10 000~15 000 0.790 0.200 0.010 船舶航行状态 上行 下行 0.522 0.478 下行船舶数量/艘 > 0~10 > 10~15 > 15 0.18 0.804 0.016 下行船舶间距/(n mile) > 0~3 > 3~6 > 6 0.260 0.729 0.011 上行船舶数量/艘 > 0~10 > 10~15 > 15 0.162 0.723 0.115 上行船舶间距/(n mile) > 0~3 > 3~6 > 6 0.074 0.172 0.754
下载: 导出CSV
表 4 载重与功率比部分条件概率表
Table 4. Partial conditional probability table of load-to-power ratio
父节点 子节点 最大载重量/t 船舶功率/kW 载重与功率比 > 0~1 > 1~2 > 2~3 > 3~4 > 4~5 > 5~6 > 6~7 > 7~8 > 8 > 2 000~2 400 > 0~270 0 0 0 0 0 0 0 0 1 > 2 000~2 400 > 270~368 0 0 0 0 0 0 0.677 0.218 0.105 > 2 000~2 400 > 368~440 0 0 0 0 0.099 0.813 0.088 0 0 > 2 000~2 400 > 440~630 0 0 0 0.401 0.375 0.224 0 0 0 > 2 000~2 400 > 630~1 000 0 0 0.403 0.597 0 0 0 0 0 > 2 000~2 400 > 1 000 0.036 0.345 0.619 0 0 0 0 0 0
下载: 导出CSV
表 6 流量突变模块区间评分表
Table 6. Scoring values of the traffic peak interval
节点 状态 流量峰值/(m3/s) > 0~25 000 > 25 000~35 000 > 35 000~45 000 > 45 000 评分值 2 3 4 5 流量变幅/(m3/s) > 5 000~10 000 > 10 000~15 000 评分值 3 5 跃迁等级 > 0~1 > 1~2 > 2~3 > 3~4 > 4 评分值 1 2 3 4 5
下载: 导出CSV
表 7 流量突变程度测量表
Table 7. Measurement scale of sudden change of flow rate
流量变幅/(m3/s) 跃迁等级 峰值区间/(m3/s) > 0~25 000 > 25 000~35 000 > 35 000~45 000 > 45 000 > 5 000~10 000 > 0~1 6 7 8 9 > 5 000~10 000 > 1~2 7 8 9 10 > 5 000~10 000 > 2~3 8 9 10 11 > 5 000~10 000 > 3~4 9 10 11 12 > 5 000~10 000 > 4 10 11 12 13 > 10 000~15 000 > 0~1 8 9 10 11 > 10 000~15 000 > 1~2 9 10 11 12 > 10 000~15 000 > 2~3 10 11 12 13 > 10 000~15 000 > 3~4 11 12 13 14 > 10 000~15 000 > 4 12 13 14 15
下载: 导出CSV
表 8 流量突变模块部分条件概率表
Table 8. Partial conditional probability table of sudden change of flow
父节点 子节点 流量跃迁等级 流量变幅/(m3/s) 流量峰值/(m3/s) 流量突变 无预警 Ⅳ级预警 Ⅲ级预警 Ⅱ级预警 Ⅰ级预警 > 2~3 > 10 000~15 000 > 0~25 000 0 0 0.95 0.05 0 > 2~3 > 10 000~15 000 > 25 000~35 000 0 0 0 0.95 0.05 > 2~3 > 10 000~15 000 > 35 000~45 000 0 0 0 0.95 0.05 > 2~3 > 10 000~15 000 > 45 000 0 0 0 0 1
下载: 导出CSV
表 9 环境条件节点条件概率表
Table 9. Partial conditional probability table of environmental conditions
父节点 子节点 满载排水量/(m3/s) 船舶功率/kW 载重与功率比 流量/(m3/s) 船舶航行状况 环境条件 良好 不良 > 0~1500 > 368~440 > 1~2 > 35000~37500 上行 0.733 0.267 > 0~1500 > 368~440 > 1~2 > 35000~37500 下行 0.950 0.050 > 0~1500 > 368~440 > 1~2 > 35000~37500 上行 0.242 0.758 > 0~1500 > 368~440 > 1~2 > 35000~37500 下行 0.728 0.272
下载: 导出CSV
表 10 模块交通复杂度节点部分条件概率表
Table 10. Partial conditional probability table of module traffic complexity module
规则 父节点 子节点 航行状况 下行航道交通复杂度 上行航道交通复杂度 交通复杂度 复杂 可控 简单 1 上行 复杂 复杂 1 0 0 2 上行 复杂 可控 0.333 0.667 0 17 下行 简单 可控 0 0.333 0.667 18 下行 简单 简单 0 0 1
下载: 导出CSV
表 11 货船航行状态节点部分概率表
Table 11. Probability table of navigable part of cargo ship sailing state
父节点 子节点 环境条件 交通复杂度 流量突变 货船航行状态 可航 不可航 良好 可控 无预警 0.90 0.10 良好 可控 Ⅳ级预警 0.88 0.12 良好 可控 Ⅲ级预警 0.86 0.14 良好 可控 Ⅱ级预警 0.85 0.15 良好 可控 Ⅰ级预警 0.82 0.18
下载: 导出CSV
表 12 历史航行记录的部分根节点状态
Table 12. States of some root nodes of historical navigation records
船名 JUHANG88 TONGXIN8 GANCHANGJIANG1HAO JIANGHAIYOU5 JIANGJIYUN1238 >满载排水量/t 9630.67 3223.58 3374 5605.5 7429.7 >最大载重量/t 7600 2585 2641 4400 6271 >船舶功率/kW 1470 440 800 1202 1150 >航行状况 下行 下行 下行 上行 上行 >流量初始值/(m3/s) 5900 32000 26000 32500 10300 >流量变幅/(m3/s) 361 7300 2484 450 900 >流量峰值/(m3/s) 6261 32400 26100 32500 11200 >船舶数量/艘 12 15 8 17 16 船舶相对间距/(n mile) 4.69 6.03 9.72 4.09 5.83
下载: 导出CSV
表 13 航行数据的验证结果
Table 13. Verification results of navigation data
船名 MMSI 通航概率/% JUHANG88 413 940 153 85 TONGXIN8 413 813 548 81 GANCHANGJIANG1HAO 413 801 349 88 JIANGHAIYOU5 413 992 341 84 JIANGJIYUN1238 413 940 534 84
下载: 导出CSV
-
[1] WU B, TIAN H, YAN X, et al. A probabilistic consequence estimation model for collision accidents in the downstream of the Yangtze river using Bayesian networks[J]. Proceedings of the Institution of Mechanical Engineers, Part O: Journal of Risk and Reliability, 2020, 234: 422-436. doi: 10.1177/1748006X19825706 [2] ZHANG Y, ZHENG Q, HE L, et al. Ship traffic optimization method for solving the approach channel and lock co-scheduling problem of the Three Gorges dam on the Yangtze river[J]. Ocean Engineering, 2023, 276: 114196. doi: 10.1016/j.oceaneng.2023.114196 [3] ZHANG Y, TIAN H, LI R, et al. Hybrid simulation model for navigation performance evaluation of the Three Gorges-Gezhouba dams under novel regulations[J]. Simulation, 2022, 98 (8): 677-698. doi: 10.1177/00375497211072536 [4] 张松, 何小聪, 梁志明. 三峡水库汛前水位集中消落调度方式优化研究[J]. 水利水电技术(中英文), 2025, 56(4): 25-34.ZHANG S, HE X C, LIANG Z M. Optimization of centralized drawdown scheduling of pre-flood water level in the Three Gorges reservoir[J]. Water Resources and Hydropower Engineering, 2025, 56(4): 25-34. (in Chinese) [5] JIANG D, WU B, CHENG Z, et al. Towards a probabilistic model for estimation of grounding accidents in fluctuating backwater zone of the Three Gorges reservoir[J]. Reliability Engineering & System Safety, 2021, 205: 107239. [6] 齐俊麟, 陈冬元, 李然. 三峡-葛洲坝梯级枢纽通航二十年创新发展与实践[J]. 中国工程科学, 2023, 25(1): 155-166.QI J L, CHEN D Y, LI R. Innovative development and practice of navigation at the Three Gorges-Gezhouba cascade hubs over the past 20 years[J]. Engineering Science, 2023, 25 (1): 155-166. (in Chinese) [7] 马晓雪, 张瑞文, 乔卫亮, 等. 基于关联规则挖掘的船员不安全行为致因网络分析[J]. 交通信息与安全, 2025, 43(2): 1-10.MA X X, ZHANG R W, QIAO W L, et al. Cause network analysis of crew unsafe behaviors based on association rule mining[J]. Journal of Transport Information and Safety, 2025, 43(2): 1-10. (in Chinese) [8] LUO M, SHIN S H. Half-century research developments in maritime accidents: future directions[J]. Accident Analysis & Prevention, 2019, 123: 448-460. [9] SUN L, ZHANG H, LIU W, et al. Research on risk assessment and control of inland navigation safety[J]. International Journal of System Assurance Engineering and Management, 2018(9): 729-738. [10] YU Q, LIU K, TEIXEIRA A P, et al. Assessment of the influence of offshore wind farms on ship traffic flow based on AIS data[J]. Journal of Navigation, 2020, 73: 131-148. doi: 10.1017/S0373463319000444 [11] ZHEN R, LV P, SHI Z, et al. A novel fuzzy multi-factor navigational risk assessment method for ship route optimization in coastal offshore wind farm waters[J]. Ocean & Coastal Management, 2023, 232: 106428. [12] CHENG Z, ZHANG Y, WU B, et al. Traffic-conflict and fuzzy-logic-based collision risk assessment for constrained crossing scenarios of a ship[J]. Ocean Engineering, 2023, 274: 114004. doi: 10.1016/j.oceaneng.2023.114004 [13] LIU K, XIN X, MA J, et al. Sensitivity analysis of ship traffic in restricted two-way waterways considering the impact of LNG carriers[J]. Ocean Engineering, 2019, 192: 106556. doi: 10.1016/j.oceaneng.2019.106556 [14] ZHANG J, TEIXEIRA A P, GUEDES SOARES C, et al. Quantitative assessment of collision risk influence factors in the Tianjin port[J]. Safety Science, 2018, 110: 363-371. doi: 10.1016/j.ssci.2018.05.002 [15] ZHANG S H, HE X C, LIANG Z M. Navigation risk assessment method based on flow conditions: a case study of the river reach between the Three Gorges dam and the Gezhouba dam[J]. Ocean Engineering, 2019, 175: 71-79. doi: 10.1016/j.oceaneng.2019.02.016 [16] ZHAO L, FU X. A method for correcting the closest point of approach index during vessel encounters based on dimension data from AIS[J]. IEEE Transactions on Intelligent Transportation Systems, 2021, 23: 13745-13757. [17] FANG Z, YU H, KE R, et al. Automatic identification system-based approach for assessing the near-miss collision risk dynamics of ships in ports[J]. IEEE Transactions on Intelligent Transportation Systems, 2018, 20: 534-543. [18] 付姗姗, 张悦, 席永涛, 等. 多因素耦合下长江口水域交通事故致因链分析[J]. 中国安全科学学报, 2023, 33(3): 60-67.FU S S, ZHANG Y, XI Y T, et al. Analysis of the causation chain of traffic accidents in the Yangtze river estuary waters under multi-factor coupling[J]. China Safety Science Journal, 2023, 33(3): 60-67. (in Chinese) [19] 常征, 何旭卓, 范瀚文. 贝叶斯网络在LNG海上运输风险评估中的应用研究[J]. 安全与环境学报, 2024, 24(12): 4541-4551.CHANG Z, HE X Z, FAN H W. Research on the application of Bayesian network in risk assessment of LNG maritime transportation[J]. Journal of Safety and Environment, 2024, 24(12): 4541-4551. (in Chinese) [20] 邵波, 刘巧, 柯善钢, 等. 融合LDA-BN的船舶碰撞事故致因分析[J]. 安全与环境学报, 2025, 25(1): 157-164.SHAO B, LIU Q, KE S G, et al. Cause analysis of ship collision accidents integrating LDA-BN[J]. Journal of Safety and Environment, 2025, 25(1): 157-164. (in Chinese) [21] WU B, YIP T L, YAN X, et al. A mutual information-based Bayesian network model for consequence estimation of navigational accidents in the Yangtze river[J]. Journal of Navigation, 2020, 73: 559-580. doi: 10.1017/S037346331900081X [22] ZHANG J, JIN M, WAN C, et al. A Bayesian network-based model for risk modeling and scenario deduction of collision accidents of inland intelligent ships[J]. Reliability Engineering & System Safety, 2024, 243: 109816. [23] KHAN B, KHAN F, VEITCH B. A dynamic Bayesian network model for ship-ice collision risk in the Arctic waters[J]. Safety Science, 2020, 130: 104858. doi: 10.1016/j.ssci.2020.104858 [24] JIANG M, LU J. Maritime accident risk estimation for sea lanes based on a dynamic Bayesian network[J]. Maritime Policy & Management, 2020, 47: 649-664. [25] FU S, ZHANG D, MONTEWKA J, et al. Towards a probabilistic model for predicting ship besetting in ice in Arctic waters[J]. Reliability Engineering & System Safety, 2016, 155: 124-136. [26] LI H, REN X, YANG Z. Data-driven Bayesian network for risk analysis of global maritime accidents[J]. Reliability Engineering & System Safety, 2023, 230: 108938. [27] LIU K, YU Q, YUAN Z, et al. A systematic analysis for maritime accidents causation in Chinese coastal waters using machine learning approaches[J]. Ocean & Coastal Management, 2021, 213: 105859. [28] KAMAL B, CAKIR E. Data-driven Bayes approach on marine accidents occurring in Istanbul strait[J]. Applied Ocean Research, 2022, 123: 103180. doi: 10.1016/j.apor.2022.103180 [29] XU X Q, WU B, MAN J, et al. Bayesian network modelling for navigation status control of cargo ships in the Three Gorges waterway[J]. Reliability Engineering and System Safety, 2024, 245: 110018. doi: 10.1016/j.ress.2024.110018 [30] LIU Z, WU Z, ZHENG Z, et al. Modelling dynamic maritime traffic complexity with radial distribution functions[J]. Ocean Engineering, 2021, 241: 109990. doi: 10.1016/j.oceaneng.2021.109990 [31] WEN Y, HUANG Y, ZHOU C, et al. Modelling of marine traffic flow complexity[J]. Ocean Engineering, 2015, 104: 500-510. doi: 10.1016/j.oceaneng.2015.04.051 [32] MERA Z, VARELLA R, BAPTISTA P C, et al. Including engine data for energy and pollutants assessment into the vehicle specific power methodology[J]. Applied Energy, 2022, 311: 118690. doi: 10.1016/j.apenergy.2022.118690 [33] YU Q, TEIXEIRA A P, LIU K, et al. An integrated dynamic ship risk model based on Bayesian networks and evidential reasoning[J]. Reliability Engineering and System Safety, 2021, 216: 107993. doi: 10.1016/j.ress.2021.107993 [34] FAN S, BLANCO-DAVIS E, YANG Z, et al. Incorporation of human factors into maritime accident analysis using a data-driven Bayesian network[J]. Reliability Engineering and System Safety, 2020, 203: 107070. doi: 10.1016/j.ress.2020.107070 [35] 赵寒寒, 杨曦, 杜荣, 等. 长江三峡—葛洲坝水利枢纽两坝间航道汛期通航流量新旧标准对比分析[J]. 中国水运, 2021, (3): 156-158.ZHAO H H, YANG X, DU R, et al. Comparative analysis of old and new standards for navigation flow in the waterway between the Three Gorges and Gezhouba water control projects of the Yangtze river during flood season[J]. China Water Transport, 2021, (3): 156-158. (in Chinese) -

 点击查看大图
计量
- 文章访问数: 48
- HTML全文浏览量: 15
- PDF下载量: 2
- 被引次数: 0