



A Quantitative Prioritization Assessment Method for Autonomous Vehicle ODD Extension Based on Interpretable Machine Learning
-
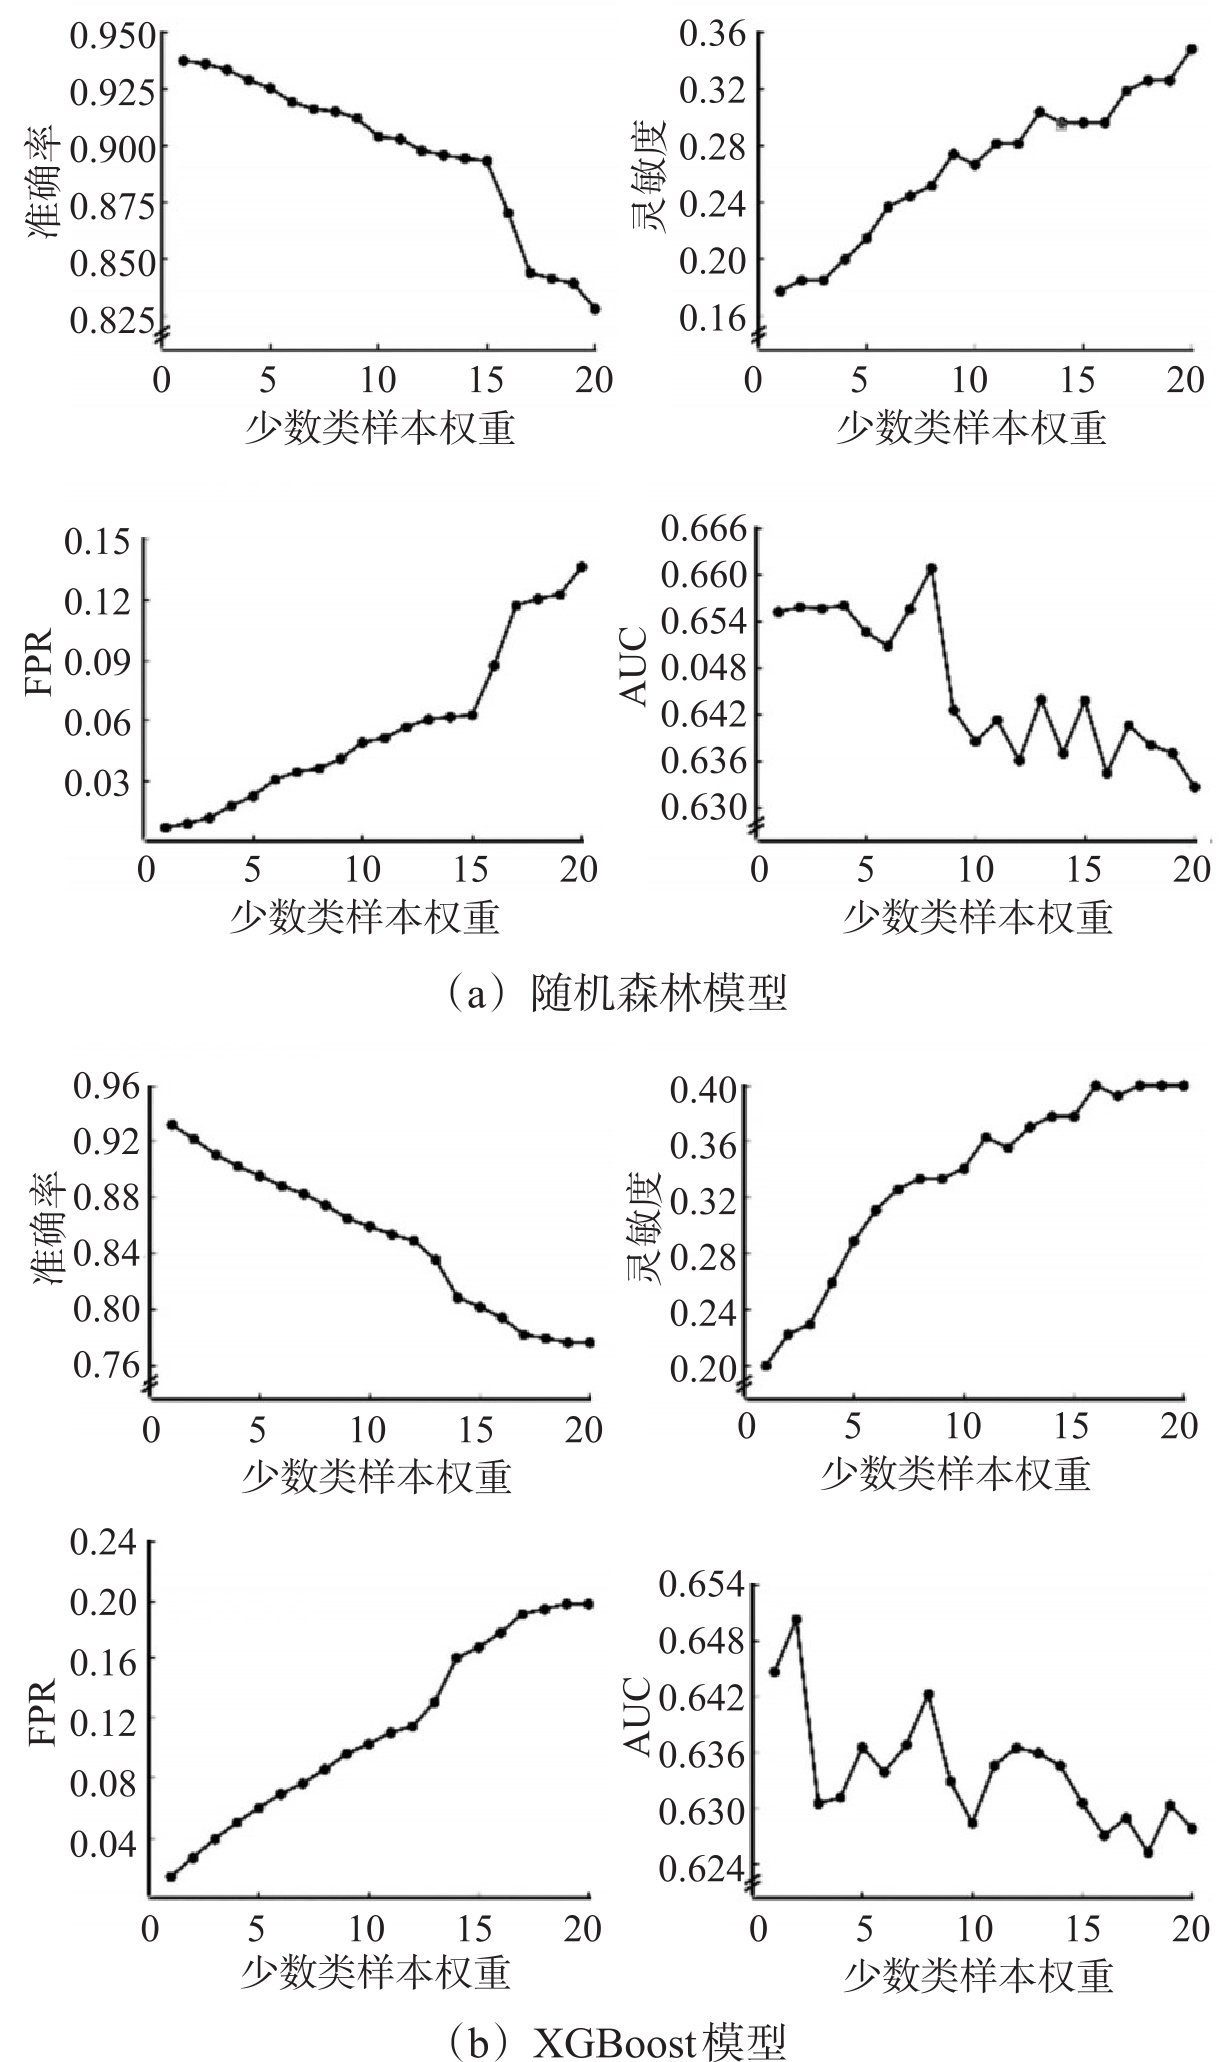
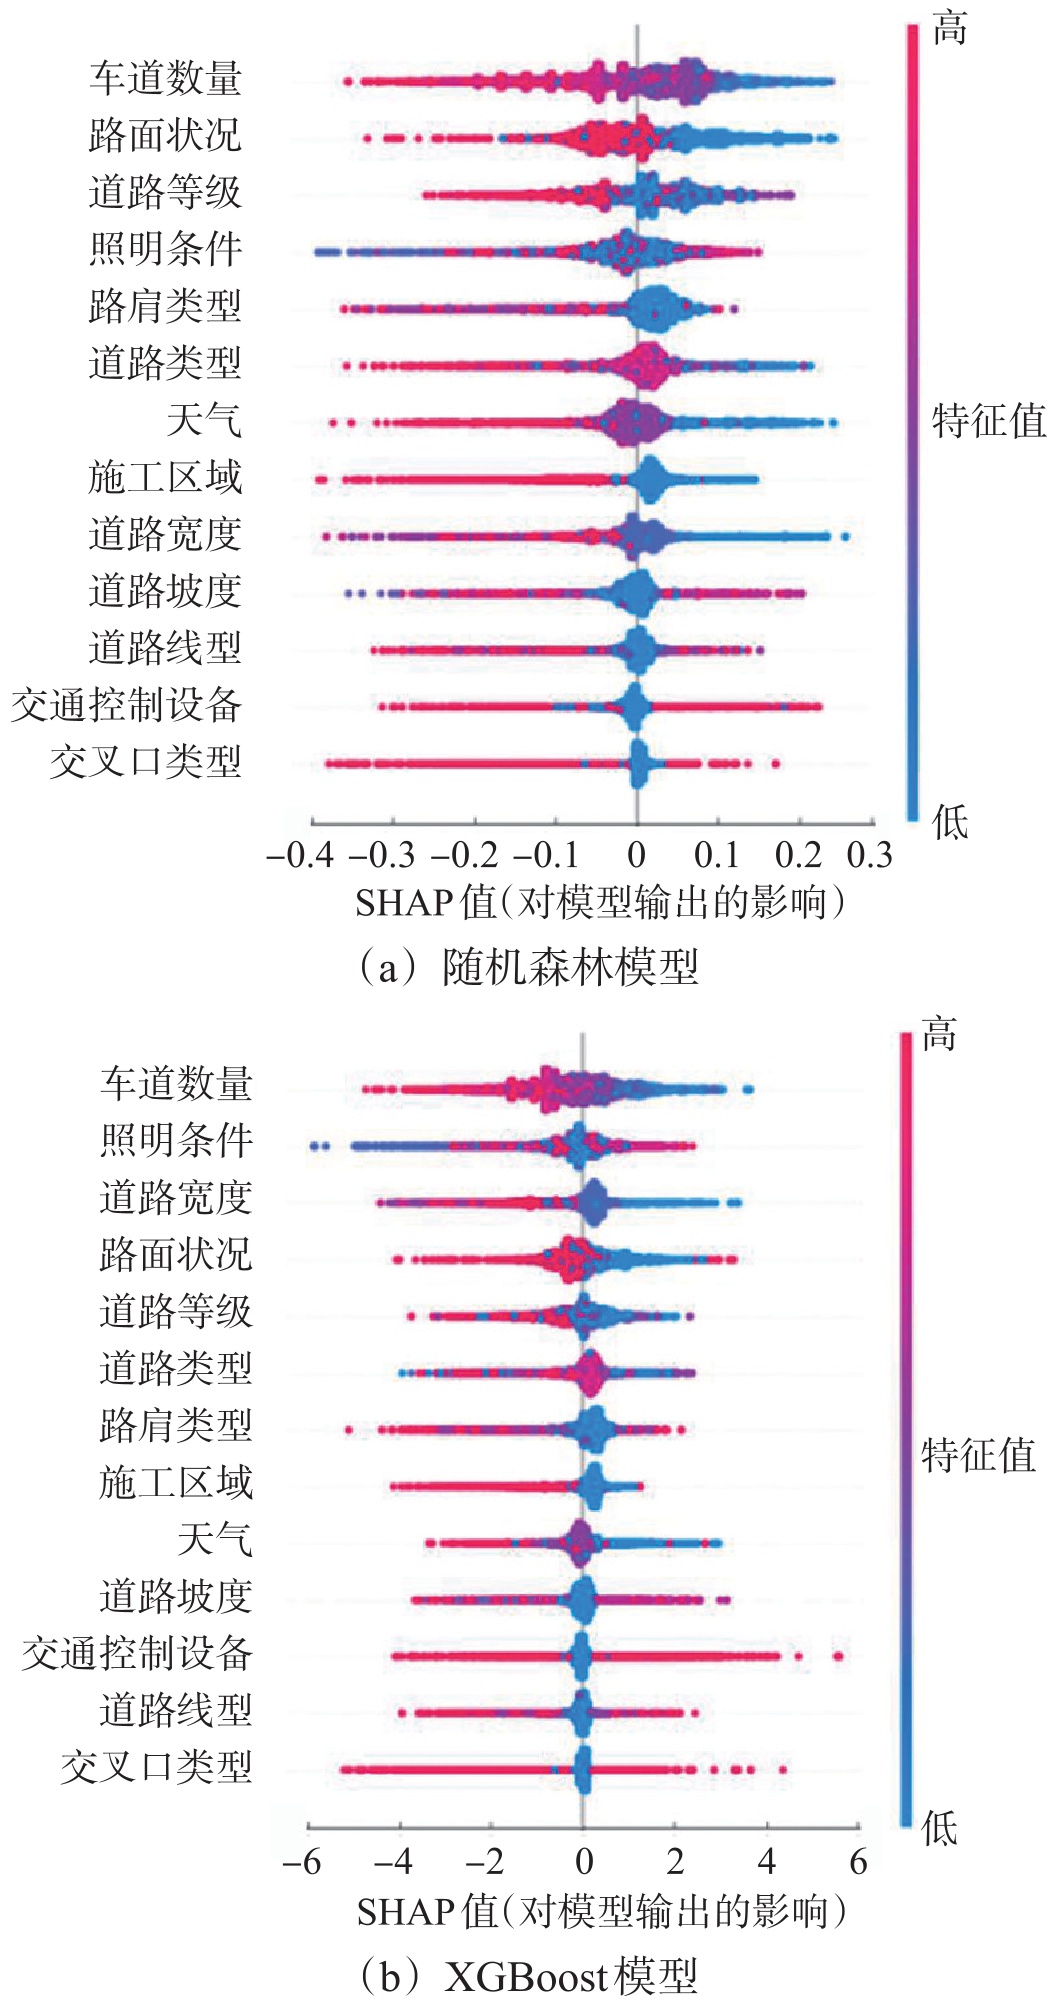
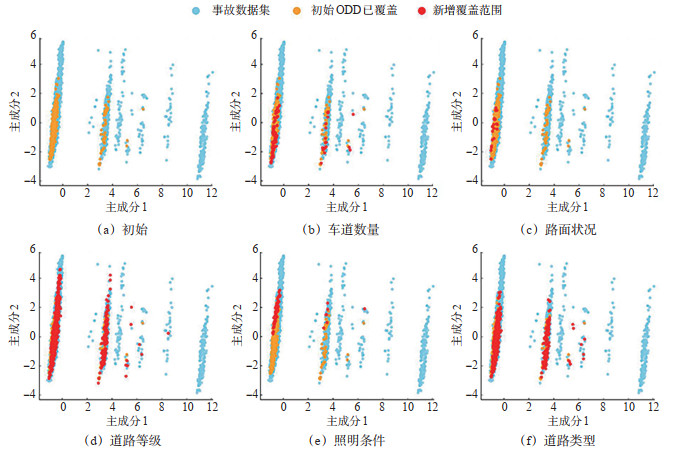
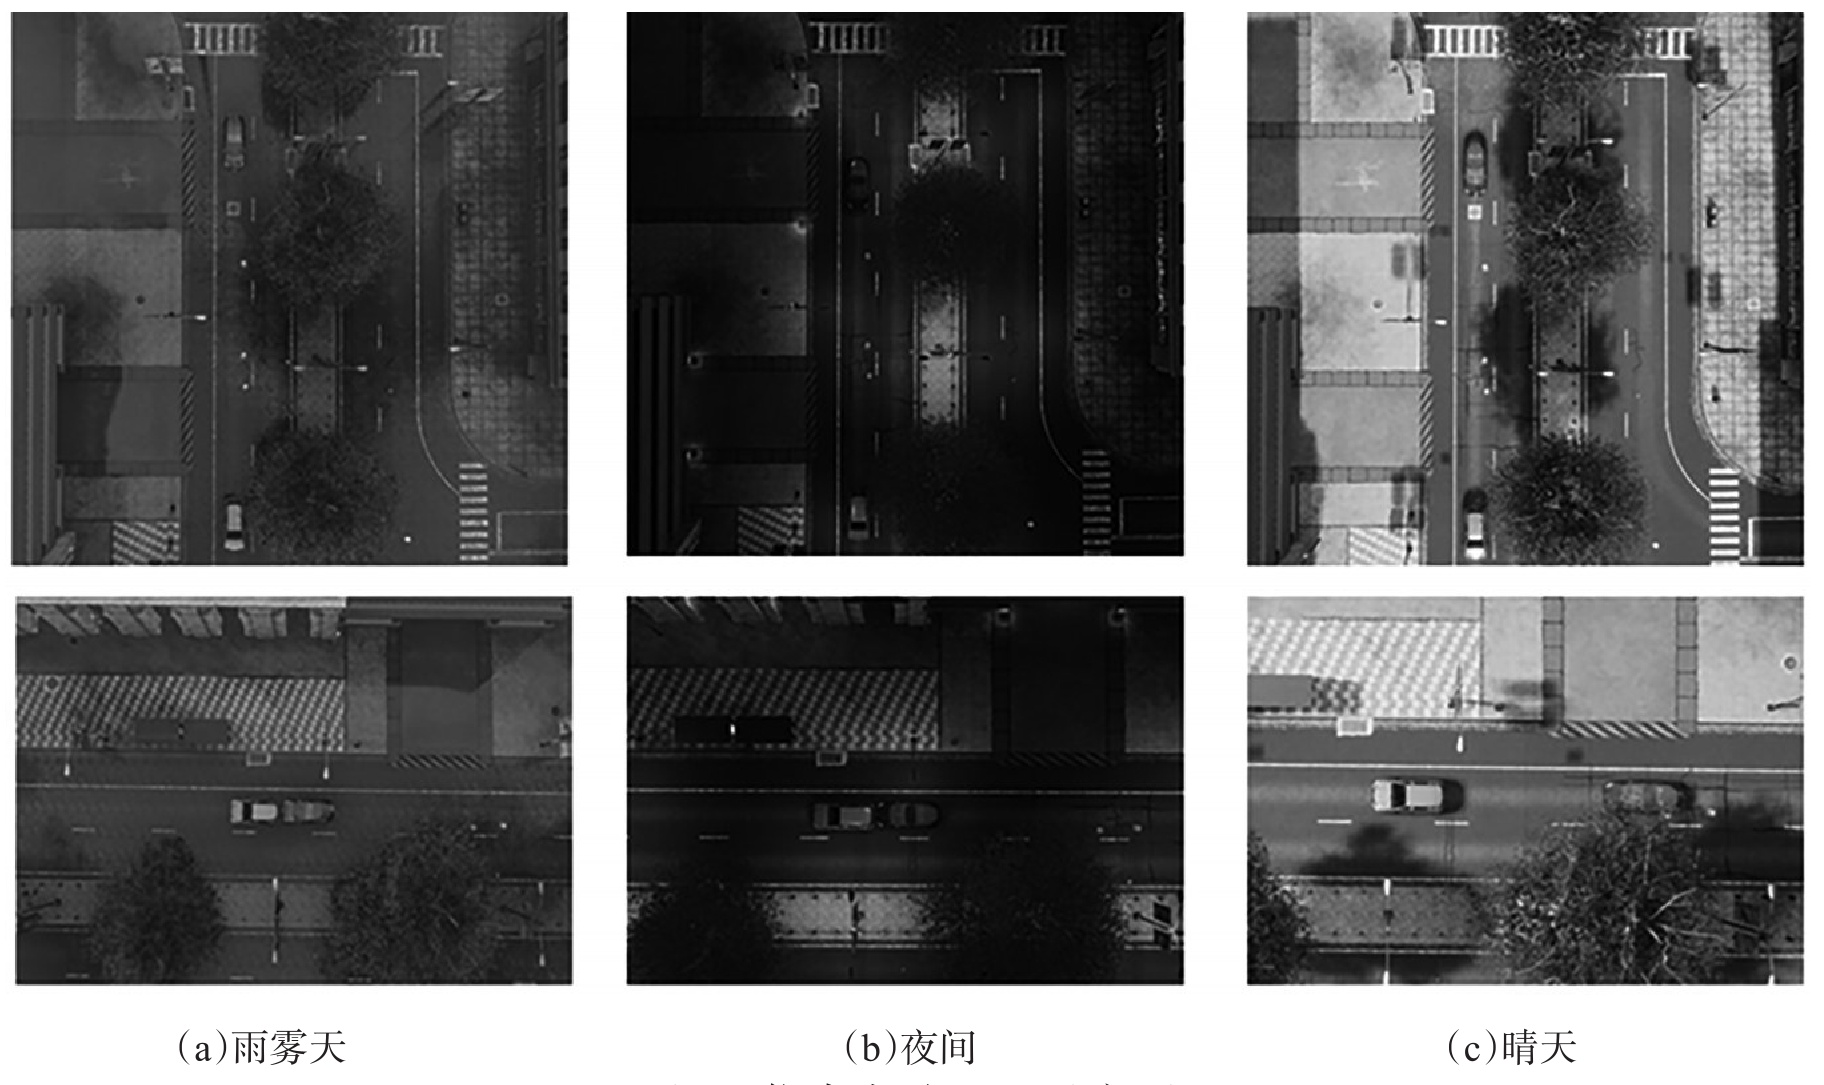
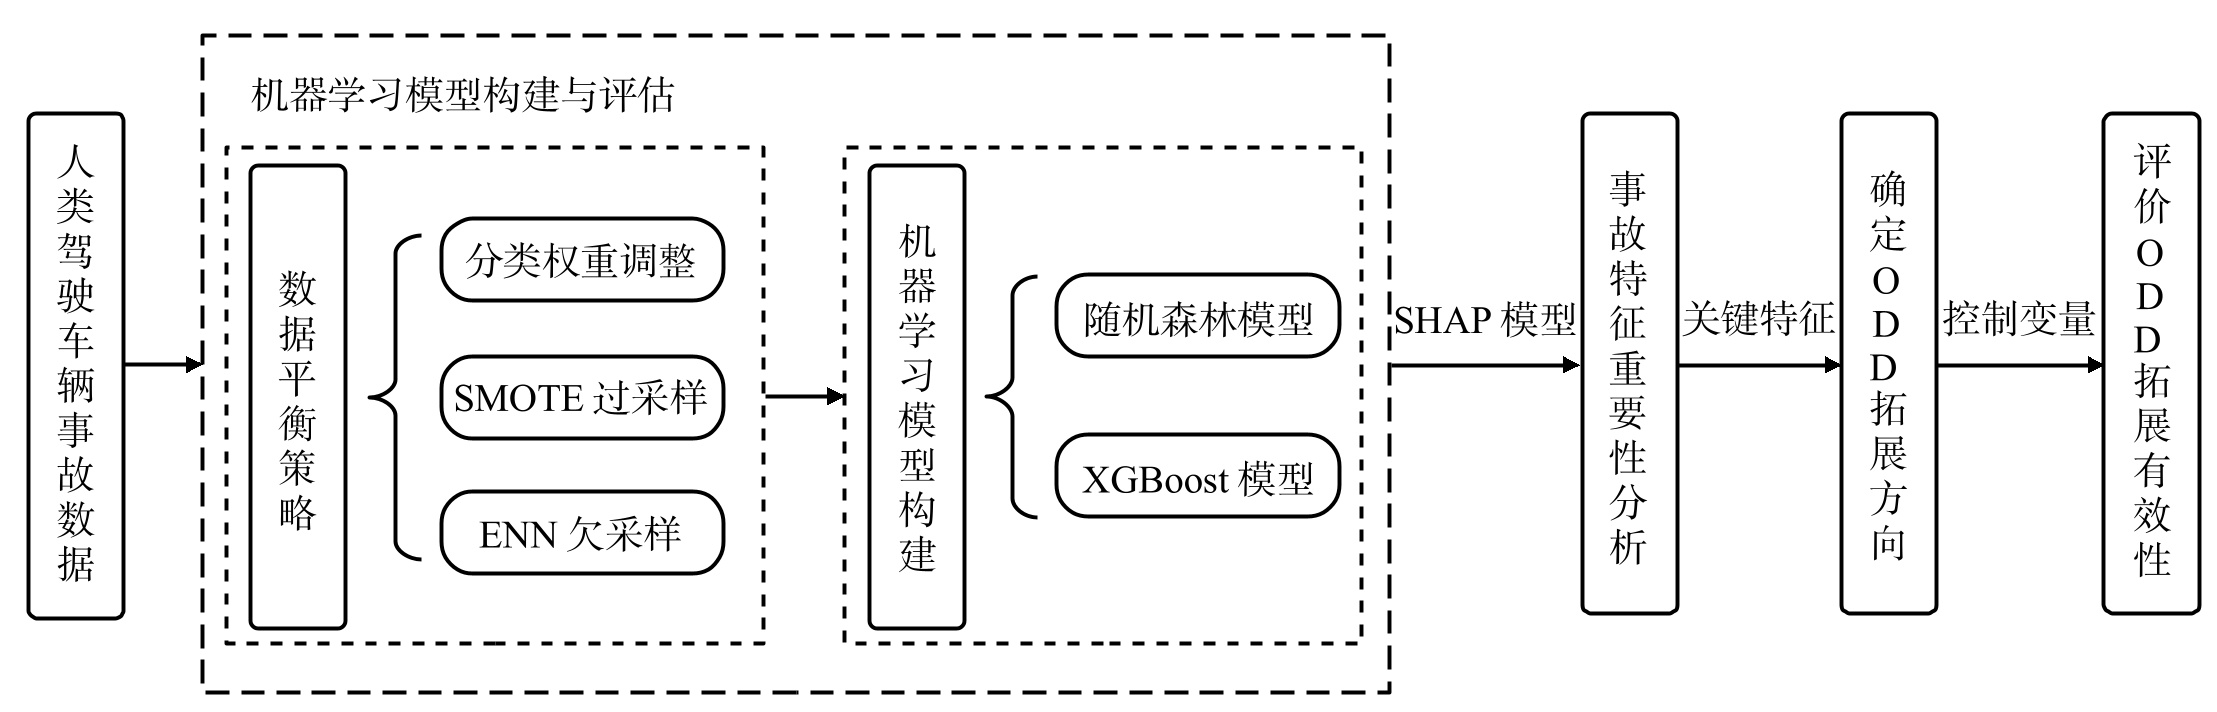
摘要: 针对自动驾驶设计运行范围(operational design domain, ODD)拓展中存在的路径模糊与决策主观性问题,研究了1种基于事故数据驱动的ODD拓展优先级量化评估框架。该框架旨在通过可解释的机器学习方法,为自动驾驶系统在复杂环境下的安全能力迭代提供数据支撑与决策依据。针对事故数据集中固有的严重事故样本长尾分布缺陷,构建随机森林与极端梯度提升(extreme gradient boosting,XGBoost)分类模型,引入少数类合成过采样技术(synthetic minority over-sampling technique,SMOTE)优化样本分布,在1∶20的分类权重比下重平衡数据集,确保了模型对少数关键样本(严重事故)的识别能力。为突破传统机器学习模型的“黑箱”局限,采用Shapley加性解释(Shapley additive explanations,SHAP)方法解构模型的内部决策机制,量化环境特征变量对事故严重程度的非线性作用阈值。建立基于控制变量法与主成分分析(principal component analysis, PCA)的ODD拓展边际效应模型,通过模拟单一ODD变量覆盖边界的外延,计算各项拓展策略下事故理论覆盖率的提升幅度。研究结果表明:经过SMOTE处理后,分类模型对少数关键严重事故样本的识别性能大幅提升,随机森林分类模型的整体准确率保持在83.4%的同时,灵敏度由原始的17.8%提升至90.5%,接收者操作特征曲线(receiver operating characteristic,ROC)下面积(area under the ROC curve,AUC)提升至0.922,实现了对高风险特征的更精准捕捉。量化评估数据显示,在候选拓展维度中,向非结构化“道路等级”拓展的安全边际效益最高:将ODD从当前主流的结构化高速公路拓展至州内及郡内公路,普通事故与严重事故的理论覆盖率可分别显著提升15.7%和13.0%。CARLA仿真实验验证显示,在低路面附着与低光照等拓展场景的紧急制动工况下,车辆碰撞率从基准组的5.0%分别激增至45.0%和20.0%,最小碰撞时间(time to collision, TTC)平均缩短1.3 s。物理层面的安全性能衰减趋势与量化评估模型得出的高风险特征排序高度一致,量化指标证明了该评估框架能够可靠地识别最具安全价值的ODD优先拓展方向。Abstract: To solve the path ambiguity and decision subjectivity in operational design domain (ODD) extension, a crash data-driven quantitative prioritization assessment framework is investigated. Data support and decision bases for safety capability iterations of autonomous driving systems in complex environments are provided by this framework. To address the long-tail distribution defect of severe crash samples, random forest and extreme gradient boosting (XGBoost) classification models are constructed. The synthetic minority over-sampling technique (SMOTE) is introduced to optimize the sample distribution. The dataset is rebalanced at a 1:20 classification weight ratio to ensure the identification capability for critical minority samples like severe crashes. To break the "black box" limitation of traditional models, the Shapley additive explanations (SHAP) method is employed to deconstruct internal decision-making mechanisms. Furthermore, the nonlinear effect thresholds of environmental feature variables on crash severity are quantified. A marginal effect model for ODD extension is established based on the control variates method and principal component analysis (PCA). By simulating the boundary expansion of a single ODD variable, the improvement in theoretical crash coverage under various extension strategies is calculated. The results indicate that the identification performance of classification models for critical severe crash samples is significantly enhanced after SMOTE processing. While an 83.4% overall accuracy is maintained, the sensitivity of the random forest model is increased from 17.8% to 90.5%. The area under the receiver operating characteristic (ROC) curve (AUC) is increased to 0.922, and high-risk features are captured more precisely. The highest marginal safety benefit among candidate dimensions is yielded by extending to unstructured road grades, as revealed by quantitative data. Theoretical coverage of ordinary and severe crashes is significantly increased by 15.7% and 13.0%, respectively, when expanding ODD from structured highways to state and county roads. Vehicle collision rates under emergency braking in extended scenarios like low road friction and low illumination are verified by CARLA simulation experiments. It is observed that collision rates are increased from 5.0% in the baseline group to 45.0% and 20.0%, respectively. Meanwhile, the average time to collision (TTC) is shortened by 1.3 seconds. The physical safety performance degradation trend is highly consistent with the high-risk feature ranking derived from the quantitative assessment model. It is proven by these quantitative indicators that the priority ODD extension direction with the greatest safety value is reliably identified by the proposed framework.
-
表 1 交通管控与照明条件变量数据分布
Table 1. Distribution of traffic control and lighting variables
变量 分类 对应值 占比/% 计数 运行条件 交通控制设备 无管制 1 88.67 10386 0 学校区域标志/装置 4 0.11 13 0 交通信号灯 5 6.24 731 1 停止标志 6 0.61 72 0 让行标志 7 0.81 95 1 闪烁信号 8 0.32 38 1 交警 10 0.28 33 1 警告标志 13 2.95 345 0 施工区域 否 0 77.57 9086 1 是 1 22.43 2627 0 照明条件 白天 1 53.97 6321 1 黄昏 2 4.32 506 1 黎明 3 2.93 343 1 黑夜, 有照明 4 21.40 2506 1 黑夜, 无照明 5 17.23 2018 0 黑夜, 未知照明情况 6 0.16 19 1  下载: 导出CSV
表 2 道路结构与线形特征变量数据分布
Table 2. Distribution of road class and cross-section variables
变量 分类 对应值 占比/% 计数 运行条件 道路线型 直线 1 76.97 9016 1 右曲线 2 13.95 1634 1 左曲线 3 9.08 1063 1 路肩类型 (混凝土或沥青)铺砌 1 73.52 8611 1 未铺砌 2 16.48 1930 0 有路肩石的路肩 3 10.01 1172 1 交叉口类型 非交叉口 1 93.48 10949 1 四方向交叉口 2 3.13 367 1 T形交叉口 3 2.33 273 1 Y形交叉口 4 0.99 116 1 环岛 6 0.06 7 1 五方向及以上交叉口 7 0.01 1 1 道路坡度 水平 1 79.36 9295 1 山顶 2 1.98 232 0 上坡 3 8.58 1005 1 下坡 4 9.47 1109 1 洼地 5 0.61 72 0
下载: 导出CSV
表 3 道路等级与断面特征变量数据分布
Table 3. Distribution of road structure and alignment variabless
变量 分类 对应值 占比/% 计数 运行条件 道路等级 州际公路 0 46.21 5412 1 美国国道 1 11.51 1348 1 州内公路 2 41.96 4915 0 郡内公路 3 0.32 38 0 道路类型 双向无分割 1 10.67 1250 0 双向无分割, 且有连续弯道 2 1.08 126 0 双向分割, 无保护 3 5.55 650 1 双向分割, 中线有屏障保护 4 68.27 7997 1 单向 5 14.43 1690 0 道路宽度/m > 0~3.66 0 6.16 722 0 > 3.66~4.27 1 68.04 7969 1 > 4.27~4.88 2 1.71 200 1 > 4.88~5.49 3 0.26 31 1 > 5.49 4 23.83 2791 1 车道数量 1 0 10.13 1186 0 2~3 1 15.27 1788 1 4~5 2 31.69 3712 1 6~7 3 30.19 3536 1 > 7 4 12.73 1491 1
下载: 导出CSV
表 4 气象与路面状况变量数据分布
Table 4. Distribution of meteorological and surface variables
变量 分类 对应值 占比/% 计数 运行条件 天气 晴天 1 13.99 1639 1 阴天 2 73.05 8556 1 雨天 3 12.58 1473 1 大雾天气 4 0.35 41 0 沙尘天气 5 0.01 1 0 冻雨/冰雹 6 0.01 1 0 强侧风 7 0.02 2 0 路面状况 干燥 1 33.01 3866 1 湿滑 2 66.10 7742 1 结冰/结霜 4 0.36 42 0 路面有油 5 0.07 8 0 泥泞 6 0.16 19 0 沙地 7 0.03 4 0 积水 8 0.27 32 0
下载: 导出CSV
表 5 事故严重程度分布
Table 5. Distribution of accident severity
分类 对应值 占比/% 计数 无 1 65.27 7 645 可能 2 15.58 1 825 非致残 3 13.05 1 528 致残 4 4.62 541 致命(30 d内) 5 1.49 174
下载: 导出CSV
表 6 模型评价指标结果
Table 6. Results of model evaluation indicators
模型 数据处理 准确率/% 灵敏度/% FPR/% AUC RF 原始 93.8 17.8 0.7 0.655 权重调整 73.8 34.6 24.1 0.620 SMOTE 83.4 90.5 23.7 0.922 ENN 56.3 53.7 40.9 0.595 XGBoost 原始 93.3 8.9 0.5 0.627 权重调整 72.5 33.5 25.9 0.609 SMOTE 83.1 89.0 21.9 0.919 ENN 57.0 53.4 40.1 0.601
下载: 导出CSV
表 7 ODD覆盖的事故分布比例
Table 7. Distribution of accidents covered by the ODD scope
变量 普通事故 严重事故 事故 占比/% 事故 占比/% 初始 2 584 23.5 149 20.8 车道数量 2 698 24.5 152 21.3 路面状况 2 604 23.7 149 20.8 道路等级 4 307 39.2 242 33.8 照明条件 3 062 27.8 184 25.7 道路类型 3 015 27.4 169 23.6
下载: 导出CSV
-
[1] KALRA N, PADDOCK S M. Driving to safety: how many miles of driving would it take to demonstrate autonomous vehicle reliability?[J]. Transportation Research Part A: Policy and Practice, 2016, 94: 182-193. doi: 10.1016/j.tra.2016.09.010 [2] 赵尧华, 陈延展, 郑亮, 等. 面向自动驾驶安全测试的碰撞场景构建与仿真分析[J]. 中国安全科学学报, 2024, 34(7): 211-218.ZHAO Y H, CHEN Y Z, ZHENG L, et al. Collision scenario construction and simulation analysis for autonomous driving safety testing[J]. China Safety Science Journal, 2024, 34(7): 211-218. (in Chinese) [3] WANG Z, MA J, LAI E M K. A survey of scenario generation for automated vehicle testing and validation[J]. Future Inter-net, 2024, 16(12): 480. doi: 10.3390/fi16120480 [4] 范博, 周重位, 张思楠, 等. 自动驾驶汽车场景测试与评估体系: 研究现状、挑战及趋势[J]. 交通信息与安全, 2025, 43 (6): 11-20. doi: 10.3963/j.jssn.1674-4861.2025.06.002FAN B, ZHONG C W, ZHANG S N, et al. Scenario-based testing and evaluation systems for autonomous vehicles: research status, challenges, and trends[J]. Journal of Transport Information and Safety, 2025, 43(6): 11-20. (in Chinese) doi: 10.3963/j.jssn.1674-4861.2025.06.002 [5] WEISSENSTEINER P, STETTINGER G, KHASTGIR S, et al. Operational design domain-driven coverage for the safety argumentation of automated vehicles[J]. IEEE Access, 2023, 11: 12263-12284. doi: 10.1109/ACCESS.2023.3242127 [6] ZHANG X, KHASTGIR S, TIELE J K, et al. ODD and behavior based scenario generation for automated driving systems[J]. IEEE Access, 2024, 12: 10652-10663. doi: 10.1109/ACCESS.2024.3350512 [7] PAPPALARDO G, CAPONETTO R, VARRICA R, et al. Assessing the operational design domain of lane support system for automated vehicles in different weather and road conditions[J]. Journal of Traffic and Transportation Engineering (English Edition), 2022, 9(4): 631-644. doi: 10.1016/j.jtte.2021.12.002 [8] 张一鸣, 胡笳, 张显宏, 等. 基于模型预测控制的卡车编队控制方法与设计运行域评估[J]. 交通与运输, 2022, 38(3): 55-60.ZHANG Y M, HU J, ZHANG X H, et al. Model-predictive-control based truck platooning method and the evaluation of operation design domain[J]. Traffic & Transportation, 2022, 38(3): 55-60. (in Chinese) [9] JIN J, HUANG H, ZHOU R, et al. Analysis of dynamic determinants of vehicles involved in crash affecting severity based on in-depth crash data[J]. Traffic Injury Prevention, 2024, 25 (3): 537-543. doi: 10.1080/15389588.2024.2312517 [10] 李江玲. 基于logit模型的路侧事故严重程度影响因素分析[D]. 北京: 北京交通大学, 2022.LI J L. Analysis of influencing factors of roadside accident severity based on logit model[D]. Beijing: Beijing Jiaotong University, 2022. (in Chinese) [11] 蓝岚, 路峰, 王军. 城市交通事故现场处理时间及影响因素分析[J]. 安全与环境学报, 2021, 21(3): 1173-1181.LAN L, LU F, WANG J. Analysis of the on-site processing time and the influential factors of the urban traffic accidents[J]. Journal of Safety and Environment, 2021, 21(3): 1173-1181. (in Chinese) [12] 戴学臻, 胡传喜, 陈茜, 等. 涉事车辆分类的高速公路重特大交通事故成因与严重程度研究[J]. 安全与环境学报, 2022, 22(5): 2583-2591.DAI X Z, HU C X, CHEN X, et al. Study on causes and severity of serious traffic accidents on freeway based on classification of involved vehicles[J]. Journal of Safety and Environment, 2022, 22(5): 2583-2591. (in Chinese) [13] 田毕江, 王国锐, 李之啸, 等. 考虑空间关联效应的山区高速公路事故分析模型研究[J]. 安全与环境学报, 2024, 24 (9): 3496-3504.TIAN B J, WANG G R, LI Z X, et al. Study on accident analysis model of mountainous highways considering space relat- ed parties effect[J]. Journal of Safety and Environment, 2024, 24(9): 3496-3504. (in Chinese) [14] ZHOU B, WANG X, ZHANG S, et al. Comparing factors affecting injury severity of passenger car and truck drivers[J]. IEEE Access, 2020(8): 153849-153861. [15] JEONG H, JANG Y, BOWMAN P J, et al. Classification of motor vehicle crash injury severity: a hybrid approach for imbalanced data[J]. Accident Analysis & Prevention, 2018, 120: 250-261. [16] CHEN J, LIU P, WANG S, et al. Prediction and interpretation of crash severity using machine learning based on imbalanced traffic crash data[J]. Journal of Safety Research, 2025, 93: 185-199. doi: 10.1016/j.jsr.2025.02.018 [17] KUO P F, HSU W T, LORD D, et al. Classification of autonomous vehicle crash severity: solving the problems of imbalanced datasets and small sample size[J]. Accident Analysis & Prevention, 2024, 205: 107666. [18] SAMADI N, JAVID R, ANSAROUDI S Z, et al. Machine learning assessment of crash severity in ADS- and ADAS-L2-involved crashes with NHTSA data[J]. Safety, 2025, 12(1): 2. doi: 10.3390/safety12010002 [19] DAWANGE A, BHOITE A, DESAI S. Analysis of machine learning models for traffic accidents severity classification[J]. International Journal of Modeling, Simulation, and Scientific Computing, 2024, 15(5): 2450041. doi: 10.1142/S1793962324500417 [20] LEE D. Driving safety area classification for automated vehicles based on data augmentation using generative models[J]. Sustainability, 2024, 16(11): 4337. doi: 10.3390/su16114337 [21] JIN J, HUANG H, YUAN C, et al. Real-time crash risk prediction in freeway tunnels considering features interaction and unobserved heterogeneity: a two-stage deep learning modeling framework[J]. Analytic Methods in Accident Research, 2023, 40: 100306. doi: 10.1016/j.amar.2023.100306 [22] 严永红, 叶珍光, 玉凯元, 等. 基于交通安全的道路照明设施景观化研究[J]. 中国安全科学学报, 2022, 32(10): 154-161.YAN Y H, YE Z G, YU K Y, et al. Research on landscapliza-tion of municipal road lighting facilities based on road traffic safety[J]. China Safety Science Journal, 2022, 32(10): 154-161. (in Chinese) -

 点击查看大图
计量
- 文章访问数: 66
- HTML全文浏览量: 23
- PDF下载量: 10
- 被引次数: 0