

An Extraction Method of Waterlogged Areas and Analysis of Road Network Traffic Capacity Based on Multi-source Remote Sensing Data Fusion
-
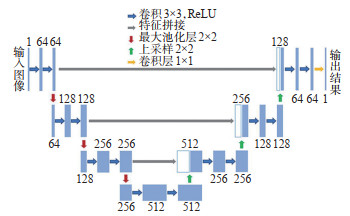
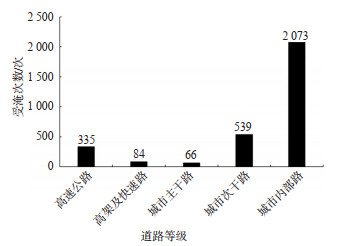
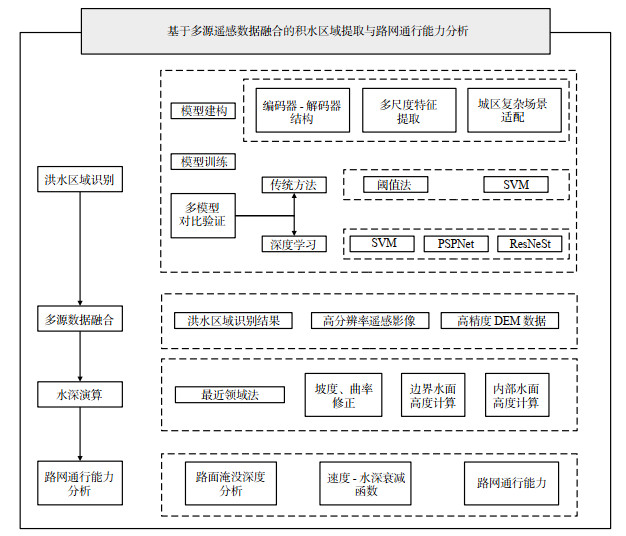
摘要: 针对洪涝灾害动态演进过程中城市交通风险难以准确量化分析的问题,研究了基于深度学习的洪水区域高精度提取方法,通过动态水动力仿真进行了城市道路在洪涝灾害中的通行能力分析,构建了涵盖洪水识别、水深计算、通行能力分析的动态路网通行评估框架。该方法融合了多时相合成孔径雷达(synthetic aperture radar,SAR)影像、光学影像和高分辨率数字高程模型(digital elevation model,DEM)数据,采用U-Net深度学习模型实现洪水区域的精准提取。基于融合遥感数据与地理信息,结合坡度、曲率等地形因子,构建洪水水位边界模型,并结合实测降水和地类信息驱动的动态水流仿真,叠加水深动态变化栅格与矢量化道路网络数据。同时,建立道路拓扑结构和通行能力更新机制,构建针对不同道路等级的水深与车速衰减模型,量化水深对通行速度的影响。基于这个模型,生成了多时刻的通行能力变化图谱,并通过复杂网络指标对路网连通性进行了量化评估。结果表明:该方法有效应对了阴影干扰、建筑物遮挡等挑战,显著提高了洪水区域分割的准确性。洪水区域识别部分的交并比和F1分数分别达到了97.56%和97.79%,优于主流模型支持向量机(support vector regression,SVR),各项指标均提升了5%左右。分析显示:在降雨量270.76 mm的情况下,城市内部道路和支路的平均水深显著高于主干道路与高速通道,水深的增加导致道路通行速度平均下降至原值的86.8%左右,城市道路通行能力平均下降约13.2%,而城市主干道的通行能力保持率为83.3%,表明高等级道路仍具备一定的应急通行潜力。此外,洪水淹没后路网结构显著退化,网络整体连通性大幅下降,节点连通性比洪水前减少了58.2%。Abstract: To address the challenge of accurately quantifying urban traffic risks during the dynamic progression of flood disasters, this study proposes a deep learning-based method for high-precision flood area extraction and analyzes the traffic capacity of urban roads during flooding through dynamic hydrodynamic simulations. A dynamic road network traffic assessment framework, encompassing flood detection, water depth calculation, and traffic capacity analysis, is established. This approach integrates synthetic aperture radar (SAR) imagery, optical imagery, and high-resolution digital elevation model (DEM) data, employing a U-Net deep learning model to precisely extract flood areas. By combining remote sensing data and geographic information, along with terrain factors such as slope and curvature, a flood water level boundary model is developed. The system utilizes real-time precipitation and land use information to drive dynamic water flow simulations, and integrates water depth change grids with vectorized road network data to estimate the inundation depth of different road types. A road topology structure and traffic capacity update mechanism are then established, including water depth and vehicle speed attenuation models for different road classes, quantifying the impact of water depth on traffic speed. Based on this model, multi-temporal traffic capacity change maps are generated, and complex network indicators are used to quantitatively assess road network connectivity. Results show that the method effectively addresses challenges such as shadow interference and building occlusion, significantly improving the accuracy of flood area segmentation. Specifically, the Intersection over Union (IoU) and F1 scores for flood area recognition achieved 97.56% and 97.79%, respectively, outperforming the support vector regression (SVR) model, with a 5% improvement across all metrics. The analysis indicates that, with a rainfall of 270.76 mm, the average water depth of internal roads and branches is significantly higher than that of arterial roads and highways. As water depth increases, the traffic speed of roads decreases by approximately 13.2%, with urban roads'traffic capacity reduced by an average of 13.2%. However, arterial roads maintain 83.3% of their traffic capacity, indicating their potential for emergency use. Furthermore, post-flood road network structure deteriorates significantly, with overall network connectivity decreasing by 58.2% compared to pre-flood conditions.
-

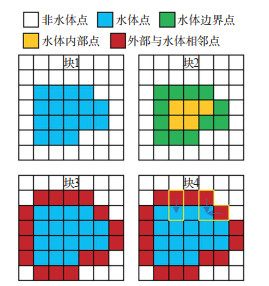
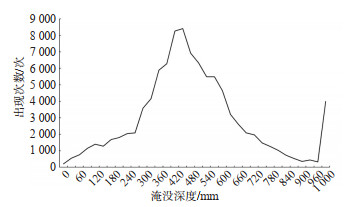
图 4 基于洪水制图的快速水深提取算法示意图
Figure 4. Schematic diagram of the fast water depth extraction algorithm based on flood mapping

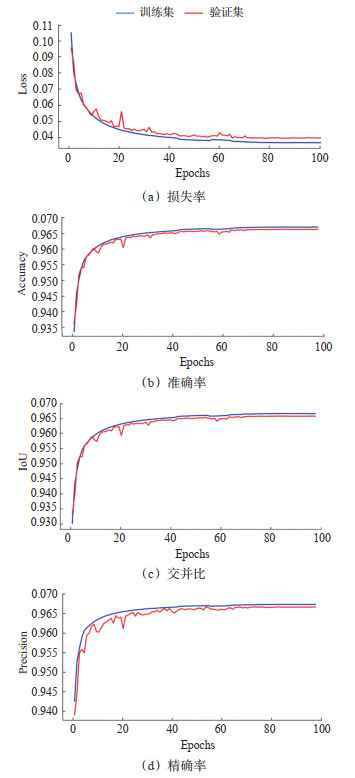
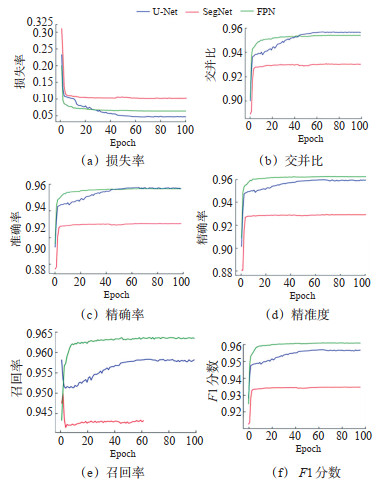
图 6 不同模型在训练集上指标变化对比图
Figure 6. Performance metric variations of different models on the training set.

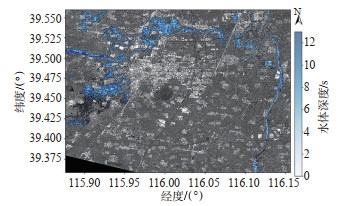
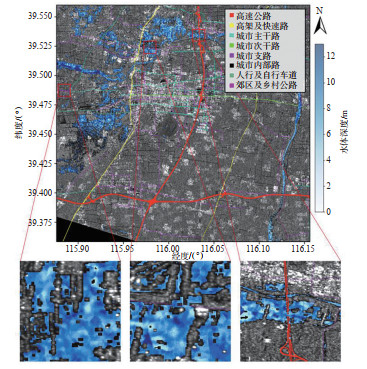
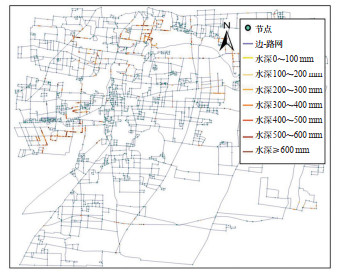
图 12 路网淹没水深示意图
Figure 12. Schematic diagram of submerged water depth in the road network

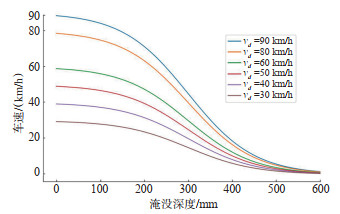
图 13 不同道路等级下车速随水深衰减模型
Figure 13. Vehicle speed decay model with water depth under different road levels
表 1 实验配置表
Table 1. Experimental configuration table
名称 配置明细 操作系统 Win10(64位) 内存 16 GB GPU NVIDIA GeForce RTX 4060 CUDA CUDA toolkit 11.8 CuDNN CuDNN v8.7.0.0 Python Python v3.8.20 PyTorch PyTorch v2.0.1+cu118 TensorFlow-GPU TensorFlow-GPU v2.10.0  下载: 导出CSV
表 2 各模型表现参数
Table 2. The performance parameters of each model
方法 交并比/% F1分数/% 精确率/% 准确率/% 召回率/% 阈值分割 87.44 89.23 85.40 86.50 88.20 SVM 91.56 92.12 91.35 91.20 93.50 PSPNet 93.51 93.25 93.62 93.29 93.43 ResNet 94.27 94.63 94.46 94.31 94.49 SegNeXt 96.58 96.95 96.42 96.85 96.57 U-Net 97.56 97.79 97.76 97.61 97.83
下载: 导出CSV
表 3 消融实验
Table 3. Ablation test
方案 SAR DEM 光学遥感 准确率/% 交并比/% A √ √ × 90.62 88.5 B √ × √ 91.18 94.3 C √ √ √ 97.61 97.56
下载: 导出CSV
表 4 涉水路段及其通行速度变化情况表
Table 4. Table of waterlogged road sections and their traffic speed variations
编号 道路类别 淹没深度/m 原最大通行速度/(km/h) 涉水最大通行速度/(km/h) 1 城市内部路 0.025 30 28.65 2 城市支路 0.042 40 37.85 3 城市次干路 0.082 50 45.93 4 高速公路 0.155 90 75.02 5 快速路 0.229 80 55.01
下载: 导出CSV
表 5 涉水路段及其通行能力变化情况表
Table 5. Table of waterlogged toad sections and changes in traffic capacity
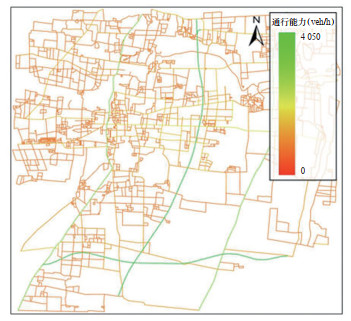
编号 道路类别 原设计通行能力/(veh/h) 涉水最大通行能力/(veh/h) 1 城市内部路 675 644 2 城市支路 1 000 946 3 城市次干路 1 500 1 377 4 高速公路 4 050 3 375 5 快速路 3 200 2 200
下载: 导出CSV
表 6 洪水淹没时路网结构表
Table 6. Table of road network structure under flood
路网状态 节点 边 平均度 洪水前 5 081 5 509 2.20 洪水后 4 677 4 887 2.05
下载: 导出CSV
表 7 洪水淹没时路网的连通程度表
Table 7. Table of road network connectivity under flood
路网状态 连通分量数量 最大连通分量 高阶节点数量 洪水前 43 4 516 786 洪水后 139 1 884 98
下载: 导出CSV
-
[1] United Nations Office for Disaster Risk Reduction. Human cost of disasters: an overview of the last 20 years (2000-2019)[R/OL]. (2020-10-12)[2025-02-27]. https://www.undrr.org/media/48008/download?startDownload=true .[2] CHEN F, ZHANG M, ZHAO H, et al. Pakistan's 2022 floods: Spatial distribution, causes and future trends from Sentinel-1 SAR observations[J]. Remote Sensing of Environment, 2024, 304: 114055. doi: 10.1016/j.rse.2024.114055 [3] 曾玲方, 李霖, 万丽华. 基于Sentinel-1卫星SAR数据的洪水淹没范围快速提取[J]. 地理信息世界, 2015, 22(5): 100-103, 107.ZENG L F, LI L, WAN L H. SAR-based fast flood mapping using Sentinel-1 imagery[J]. Geomatics World, 2015, 22(5): 100-103, 107. (in Chinese) [4] 陈赛楠, 蒋弥. Sentinel-1 SAR在洪水范围提取与极化分析中的应用研究[J]. 地球信息科学学报, 2021, 23(6): 1063-1070.CHEN S N, JIANG M. Application research of Sentinel-1 SAR in flood range extraction and polarization analysis[J]. Journal of Geo-information Science, 2021, 23 (6) : 1063-1070. (in Chinese) [5] HAMIDI E, PETER B G, MUÑOZ D F, et al. Fast flood extent monitoring with SAR change detection using google earth engine[J]. IEEE Transactions on Geoscience and Remote Sensing, 2023, 61: 1-19. [6] 龚蒙, 张永宏, 孙书林, 等. DPL-Net: 用于高分辨率遥感图像的水体提取网络[J]. 计算机工程与应用, 2025, 61(16): 224-233.GONG M, ZHANG Y H, SUN S L, et al. DPL-net: network for water body extraction in high-resolution remote sensing images[J]. Computer Engineering and Applications, 2025, 61 (16): 224-233. (in Chinese) [7] LI Y, MARTINIS S, WIELAND M. Urban flood mapping with an active self-learning convolutional neural network based on TerraSAR-X intensity and interferometric coherence[J]. ISPRS Journal of Photogrammetry and Remote Sensing, 2019, 152: 178-191. doi: 10.1016/j.isprsjprs.2019.04.014 [8] WU M, XIN Y, WU Z, et al., Study of the effects of urban elements on traffic access in flooding at the neighbourhood scale[J]. Journal of Hydrology, 2025. 663: 134207. doi: 10.1016/j.jhydrol.2025.134207 [9] CHEN F, ZHANG M, ZHAO H, et al. Pakistan's 2022 floods: spatial distribution, causes and future trends from Sentinel-1 SAR observations[J]. Remote Sensing of Environment, 2024, 304: 114055. doi: 10.1016/j.rse.2024.114055 [10] 代鑫, 黄弘, 汲欣愉, 等. 基于机器学习的城市暴雨内涝时空快速预测模型[J]. 清华大学学报(自然科学版), 2023, 63 (6): 865-873.DAI X, HUANG H, JI X Y, et al. Spatio-temporal rapid prediction model for urban flooding under heavy rain based on machine learning[J]. Tsinghua Univ (Sci & Technol), 2023, 63(6): 865-873. (in Chinese) [11] MA F, ZHANG Y, LIU Q, et al. Modeling urban transportation safety resilience under extreme rainstorms: a catastrophe theory approach[J]. Reliability Engineering & System Safety, 2025, 263: 111301. [12] SONG Y, GUO L, WANG C, et al. Urban road waterlogging multi-level assessment integrated flood models and road network models[J]. Transportation Research Part D: Transport and Environment, 2024, 133: 104305 doi: 10.1016/j.trd.2024.104305 [13] QIAO Y, WANG Y, JIN N, et al. Assessing flood risk to urban road users based on rainfall scenario simulations[J]. Transportation Research Part D: Transport and Environment, 2023, 123: 103919. doi: 10.1016/j.trd.2023.103919 [14] ZAHURA F T, GOODALL J L, CHEN T D. Using crowd-sourced data to estimate passenger vehicle travel delays from nuisance flooding[J]. Transportation Research Part D: Transport and Environment, 2024, 133: 104307. doi: 10.1016/j.trd.2024.104307 [15] HE K, PREGNOLATO M, CARHART N, et al. Functionality assessment of road network combining flood roadworthiness and graph topology[J]. Transportation Research Part D: Transport and Environment, 2024, 135: 104354. doi: 10.1016/j.trd.2024.104354 [16] 梅超, 陈宇枫, 刘家宏, 等. 基于情景模拟的城市内涝对道路交通的影响评估[J]. 水资源保护, 2022, 38(6): 31-38.MEI C, CHEN Y F, LIU J H, et al. Impact assessment of urban waterlogging on road traffic based on scenario simulation[J]. Water Resources Protection, 2022, 38(6): 31-38. (in Chinese) [17] LI W, WU J, CHEN H, et al. U-Net combined with attention mechanism method for extracting flood submerged range[J]. IEEE Journal of Selected Topics in Applied Earth Observations and Remote Sensing, 2022, 15: 6588-6597. doi: 10.1109/JSTARS.2022.3194375 [18] WANG Z. Disaster remote sensing image semantic segmentation model with boundary constraints based on SegNeXt[C]. IEEE 3rd International Conference on Neural Networks, Information and Communication Engineering(NNICE), 2023. [19] KRAMER M, TERHEIDEN K, WIEPRECHT S. Safety criteria for the trafficability of inundated roads in urban floodings[J]. International Journal of Disaster Risk Reduction, 2016, 17: 77-84. doi: 10.1016/j.ijdrr.2016.04.003 [20] OTSU, N. A threshold selection method from gray-level histograms, [J]. IEEE Transactions on Systems, Man, and Cybernetics, 1979, 9(1): 62-66. doi: 10.1109/TSMC.1979.4310076 [21] VAPNIK V, IZMAILOV R. Reinforced SVM method and memorization mechanisms[J]. Pattern Recognition, 2021, 119: 108018. doi: 10.1016/j.patcog.2021.108018 [22] ZHAO H, SHI J, QI X, et al. Pyramid scene parsing network[C]. IEEE Conference on Computer Vision and Pattern Recognition: IEEE, 2017. [23] HE K, ZHANG X, REN S, et al. Deep residual learning for image recognition[C]. IEEE Conference on Computer Vision and Pattern Recognition: IEEE, 2016. -

 点击查看大图
计量
- 文章访问数: 9
- HTML全文浏览量: 11
- PDF下载量: 1
- 被引次数: 0