

dentification of Causes and Factor Correlation Mining Methods for Truck Traffic Accidents in Mountainous Areas
-
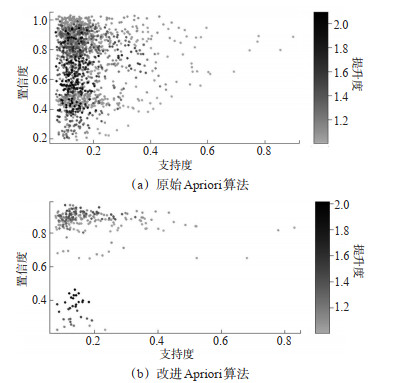
摘要: 针对货车交通事故诱因识别难、因素关联影响不清晰等问题,研究了山岭重丘区货车交通事故诱因识别与因素关联挖掘方法。收集了广东省某山岭重丘区货运高速公路1 839起货车事故数据,通过数理统计方法,分析了山岭重丘区货车交通事故时空分布;基于改进的Apriori算法,挖掘了山岭重丘区货车交通事故影响因素的关联规则,得到全要素、自相关、特定维度(时间、道路要素)和事故维度之间共571条关联规则。关联挖掘模型评估结果表明:改进Apriori算法的准确性较传统Apriori算法提升了86.4%;关联规则挖掘结果显示:晴天、纵坡坡度小于2%与轻微事故关联的提升度大于1.0,即:轻微事故主要发生在该组合路段;操作不当、安全距离不足与侧翻和追尾事故的关联提升度大于1.8,即单车的侧翻和追尾主要由该因素导致;坡度-2%~-3%、半径大于1 000 m与重大事故关联的提升度大于1.6,即:重大、特大货车交通事故主要发生在坡度2%~3%、半径大于1 000 m的下坡路段;凌晨01:00—03:00与伤人事故的关联提升度大于1.3,即伤人事故主要集中在凌晨;研究结果揭示了山岭重丘区货车交通事故原因,发现了货车交通事故要素之间的关联性。Abstract: In response to the difficulties in identifying the causes of truck traffic accidents and the unclear influence of factors, a method for identifying the causes of truck traffic accidents and mining the relationships between factors in mountainous and hilly areas is studied. Data from 1, 839 truck accidents on a freight expressway in a mountainous and hilly area of Guangdong Province are collected. Through mathematical statistical methods, the spatiotemporal distribution of truck traffic accidents in mountainous and hilly areas is analyzed. Employing an improved Apriori algorithm, the study mined association rules to uncover factors influencing truck traffic accidents, resulting in 571 rules across comprehensive, self-correlated, specific dimensions (time, road elements), and accident dimensions. The model evaluation results indicate that the accuracy of the improved Apriori algorithm is 86.4% higher than that of the traditional Apriori algorithm. The results of association rule mining reveal: Clear weather conditions and longitudinal slopes less than 2% are significantly associated with minor accidents (lifted confidence>1.0), indicating that minor accidents primarily occur under these road conditions; Improper operation and insufficient safe distance are strongly associated with rollover and rear-end accidents (lifted confidence>1.8), suggesting that these accidents are predominantly caused by these factors; Slopes between -2% to -3% and radii greater than 1 000 m are significantly associated with major accidents (lifted confidence>1.6), indicating that major and severe truck accidents mainly occur on downhill sections with these slope and radius characteristics; Accidents causing injuries are significantly associated with the hours between 01:00 to 03:00 am (lifted confidence>1.3), highlighting a concentration of injury accidents during the early morning hours. The research results have revealed the causes of truck traffic accidents in mountainous and hilly areas and discovered the correlations among the elements of truck traffic accidents.
-
Key words:
- traffic safety /
- tuck accidents /
- association mining method /
- Apriori algorithm /
- mountainous Areas
-

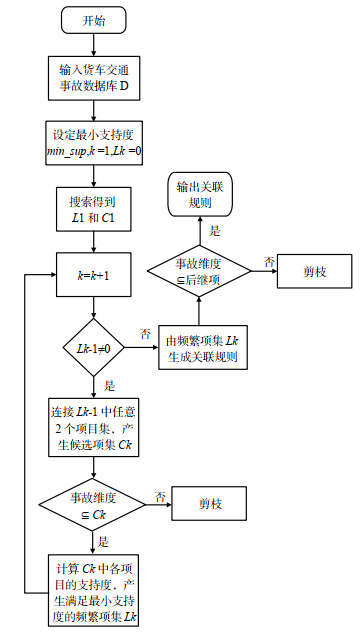
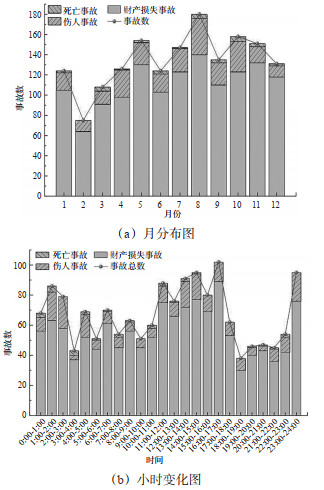
图 1 货车交通事故时间分布特征
Figure 1. Time distribution characteristics of truck traffic accidents

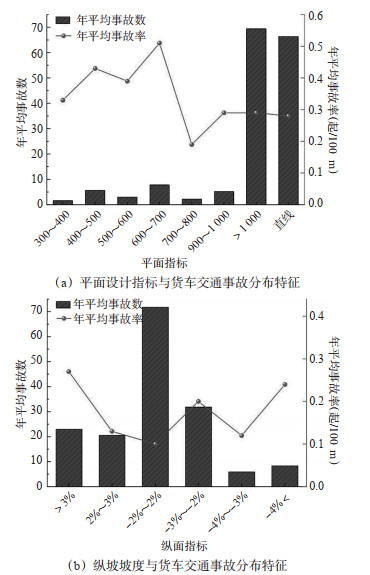
图 2 道路几何设计指标与货车交通事故分布特征
Figure 2. Distribution characteristics of road geometric design indicators and truck traffic accidents

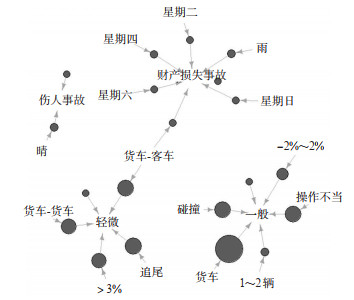
图 4 前25条全映射关联规则网络图
Figure 4. Network diagram of the top 25 fully mapped association rules

图 5 前10条事故自相关关联规则网络图
Figure 5. Network diagram of the top 10 accident self-correlated association rules

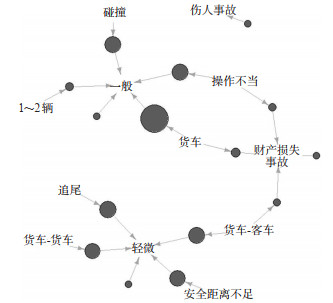
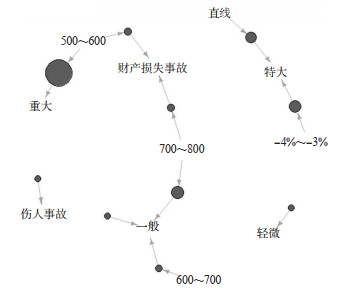
图 6 前10条道路维度与事故维度关联规则网络图
Figure 6. Network diagram of the top 10 association rules between road dimension and accident dimension
表 1 货车交通事故影响因素综述
Table 1. Overview of factors influencing truck traffic accidents
研究变量 数据来源 模型方法 研究结论 驾驶人因素 年龄 中国四川省某山区高速公路2013—2018年货车事故 随机参数有序Logit模型 年龄对货车事故严重程度无显著影响[2] 公路安全信息系统10年事故数据 混合Logit模型 50岁以上的货车驾驶人更容易导致致死事故[13] 美国德克萨斯州事故记录信息系统 随机参数Logit模型 年轻驾驶人会导致货车事故严重程度增加[14],具有更高的致死概率 性别 美国怀俄明州I-80公路事故数据 基于贝叶斯的二元Logistic模型 女性驾驶人更容易导致致死事故[15] 美国洛杉矶8年货车事故数据 随机参数Logit模型 男性驾驶人更有可能卷入严重和无伤害的碰撞事故[10] 超速 2017—2019年中国京沪和长深高速公路交通事故数据 随机参数Logit模型 超速会增加货车事故中严重和致命伤害的可能性[1] 疲劳驾驶 2012—2017年中国浙江省辖区内高速公路货车交通事故数据 Apriori关联算法 疲劳驾驶容易导致货车死亡事故[16] 车辆因素 车辆类型 联邦汽车运输安全管理局 梯度提升算法 液罐车、平板货车及牵引挂车会极大增加事故的严重程度[17] 货车重量 美国新泽西事故数据 Logit和Probit模型 货车重量与事故严重程度呈正相关关系[18] 道路因素 限速 美国俄亥俄州高速公路安全信息系统事故数据 混合Logit模型 限速值与重大和轻微伤害呈现正相关关系[19],速度降低会降低事故严重程度。 交通标志 公路安全信息系统10年事故数据 混合Logit模型 停车标志/闪光灯会降低事故严重程度和致死事故发生概率[13] 圆曲线半径 美国怀俄明州I-80公路事故数据 基于贝叶斯的二元Logistic模型 曲线路段会导致事故严重程度增加[15] 纵坡坡度 美国怀俄明州I-80公路事故数据 基于贝叶斯的二元Logistic模型 下坡路段发生严重事故的概率是其他路段的2.1倍[15] 路面状况 联邦汽车运输安全管理局 梯度提升算法 潮湿的路面条件更容易发生致死事故[17] 环境因素 能见度 联邦铁路管理局数据库 有序Probit模型 低能见度会极大增加事故的严重程度[20] 天气类型 联邦汽车运输安全管理局 梯度提升算法 阴天、雨、雪、雾和雨夹雪等恶劣天气条件下,事故严重程度和发生概率会增加[5] 美国内布拉斯加州高速公路事故数据和气象数据 随机参数有序Logit模型 高温天气、降雨、大风会增加事故严重程度[21] 交通特征 交通量 美国田纳西州交通运输部事故记录信息系统 多项Logit模型和负二项模型 年均日交通流量(AADT)与事故严重程度呈负相关关系[8] 货车混入率 美国德克萨斯州事故记录信息系统 随机参数Logit模型 货车混入率越高,傍晚发生致命事故的概率越高[14] 事故特征 追尾 2013—2018年中国四川省某山区高速公路货车事故 随机参数有序Logit模型 追尾会显著影响山区高速公路货车事故严重程度[2] 美国洛杉矶8年货车事故数据 随机参数Logit模型 追尾会增加无伤和轻伤事故概率,降低重伤事故概率[10] 冲出道路 公路安全信息系统10年事故数据 混合Logit模型 冲出道路会显著影响事故严重程度[13] 侧滑 美国洛杉矶8年货车事故数据 随机参数Logit模型 侧滑会增加无伤事故概率,降低重伤事故概率[10] 时间特征 不同时段 联邦铁路管理局数据库 有序Probit模型 高峰时段更容易发生货车事故,并且会增加货车事故严重程度[20] 中国重特大货车事故数据 故障树分析法 18:00—09:00发生重特大事故风险的概率会显著增加[2] 空间特征 交叉口 美国洛杉矶8年货车事故数据 随机参数Logit模型 交叉口上发生货车交通事故的概率更高[10]  下载: 导出CSV
表 2 高速公路货车交通事故数据指标及取值
Table 2. Indicators and values of highway truck traffic accident data
维度 指标 具体取值 说明 时间 小时 00:00—01:00;01:00—02:00;…;23:00—24:00 星期 星期一;星期二;…;星期日 月份 1月;2月:…;12月 车辆 涉事车辆类型 单一货车;货车-货车;货车-客车 涉事车辆数量 1~2辆;3~4辆;≥5辆 道路 圆曲线半径/m >300~400;>400~500;>500~600;>600~700;>700~800;>800~900;>900~1 000;>1 000;直线 纵坡坡度/% ≤-4;>-4~-3;>-3~-2;>-2~2;>2~3;>3 环境 天气 晴天、阴天、小雨、雨 交通事故数据中记录的天气类型 事故 事故原因 安全距离不足;操作不当;超速;车辆故障;装载不当;疲劳驾驶;车辆爆胎 事故认定原因有11种,合并精简为7类 事故形态 侧翻;车辆着火;碰撞;追尾 原始数据有8种事故形态,合并精简为4类 事故严重性 轻微;一般;重大;特大 根据国务院发布的《交通事故处理办法》划分 事故类型 财产损失事故;伤人事故;死亡事故
下载: 导出CSV
表 3 不同支持度和置信度组合计算的关联规则数
Table 3. Number of association rules calculated for different combinations of support and confidence
支持度\置信度 0.1 0.12 0.14 0.16 0.18 0.2 0.01 117 151 82 724 81 596 79 315 77 131 75 636 0.05 5 832 5 802 5 762 5 578 5 514 5 486 0.1 1 661 1 660 1 653 1 629 1 623 1 618 0.2 351 351 351 351 351 351 0.3 127 127 127 127 127 127 0.5 22 22 22 22 22 22 0.7 6 6 6 6 6 6
下载: 导出CSV
表 4 改进Aprior算法挖掘的前25条全映射关联规则
Table 4. Top 25 fully mapped association rules mined by improved Aprior algorithm
序号 先导项 后继项 支持度 置信度 提升度 1 {1~2辆,晴,货车-客车} {轻微} 0.123 0.926 1.398 2 {1~2辆,货车-客车} {轻微} 0.157 0.923 1.395 3 {直线, 货车} {财产损失事故} 0.167 0.922 1.112 4 {1~2辆,直线,货车} {财产损失事故} 0.167 0.922 1.112 5 {1~2辆,雨} {财产损失事故} 0.148 0.912 1.101 6 {-2%~2%,1~2辆,直线} {财产损失事故} 0.161 0.909 1.096 7 {-2%~2%,货车} {财产损失事故} 0.180 0.907 1.094 8 {-2%~2%,1~2辆,货车} {财产损失事故} 0.180 0.907 1.094 9 {晴,货车-客车} {轻微} 0.168 0.903 1.364 10 {货车-客车} {轻微} 0.211 0.902 1.362 11 {晴,直线,货车} {财产损失事故} 0.113 0.901 1.088 12 {1~2辆,晴,直线,货车} {财产损失事故} 0.113 0.901 1.088 13 {货车} {财产损失事故} 0.410 0.899 1.085 14 {1~2辆,货车} {财产损失事故} 0.410 0.899 1.085 15 {-2%~2%,货车-客车} {轻微} 0.101 0.896 1.353 16 {-2%~2%,1~2辆,晴,直线} {财产损失事故} 0.115 0.894 1.079 17 {>1 000,货车} {财产损失事故} 0.182 0.894 1.078 18 {1~2辆,>1 000,货车} {财产损失事故} 0.182 0.894 1.078 19 {-2%~2%,直线} {财产损失事故} 0.179 0.892 1.076 20 {-2%~2%,晴,货车} {财产损失事故} 0.122 0.891 1.075 21 {-2%~2%,1~2辆,晴,货车} {财产损失事故} 0.122 0.891 1.075 22 {1~2辆,星期四} {财产损失事故} 0.107 0.887 1.070 23 {直线,货车-货车} {轻微} 0.110 0.885 1.337 24 {1~2辆,货车-货车} {轻微} 0.244 0.883 1.334 25 {>3%,晴} {轻微} 0.107 0.883 1.333
下载: 导出CSV
表 5 前10条事故自相关关联规则
Table 5. Top 10 Accident self-correlated association rules
序号 先导项 后继项 支持度 置信度 提升度 1 {操作不当,货车} {侧翻} 0.057 0.157 2.435 2 {1~2辆,操作不当,货车} {侧翻} 0.057 0.157 2.435 3 {货车} {侧翻} 0.063 0.137 2.128 4 {1~2辆,货车} {侧翻} 0.063 0.137 2.128 5 {1~2辆,安全距离不足,货车-货车} {追尾} 0.102 0.583 2.062 6 {1~2辆,安全距离不足,货车-客车} {追尾} 0.063 0.571 2.018 7 {安全距离不足,货车-货车} {追尾} 0.108 0.566 2.003 8 {安全距离不足,货车-客车} {追尾} 0.088 0.563 1.993 9 {1~2辆,安全距离不足} {追尾} 0.172 0.543 1.921 10 {安全距离不足} {追尾} 0.204 0.537 1.898
下载: 导出CSV
表 6 时间维度与事故维度关联规则
Table 6. Association rules between time dimension and accident dimension
序号 先导项 后继项 支持度 置信度 提升度 1 {02:00—03:00} {伤人事故} 0.013 0.266 1.743 2 {8月} {重大} 0.013 0.117 1.680 3 {星期二} {重大} 0.015 0.111 1.600 4 {08:00—09:00} {一般} 0.014 0.349 1.591 5 {01:00—02:00} {伤人事故} 0.012 0.221 1.449 6 {4月} {伤人事故} 0.017 0.214 1.405 7 {2月} {一般} 0.014 0.307 1.397 8 {17:00—18:00} {一般} 0.012 0.306 1.396 9 {星期一} {伤人事故} 0.031 0.209 1.372 10 {14:00—15:00,星期五} {轻微} 0.011 0.900 1.359
下载: 导出CSV
表 7 道路维度与事故维度关联规则
Table 7. Association rules between road dimension and accident dimension
序号 先导项 后继项 支持度 置信度 提升度 1 {-3%~-2%,>1 000,晴} {特大} 0.012 0.222 4.537 2 {-3%~-2%,>1 000} {特大} 0.015 0.194 3.952 3 {-3%~-2%,>1 000} {重大} 0.017 0.218 3.136 4 {-3%~-2%,晴} {特大} 0.018 0.123 2.520 5 {>1 000,雨} {重大} 0.013 0.167 2.400 6 {-3%~-2%} {特大} 0.020 0.104 2.119 7 {-3%~-2%} {重大} 0.025 0.129 1.857 8 {2%~3%,晴} {重大} 0.012 0.122 1.754 9 {-2%~2%,直线,雨} {一般} 0.014 0.377 1.718 10 {>3%,晴,直线} {伤人事故} 0.014 0.253 1.658
下载: 导出CSV
表 8 基于原始Aprior算法挖掘的部分全映射关联规则
Table 8. Partial fully mapped association rules mined based on the original Aprior algorithm
序号 先导项 后继项 支持度 置信度 提升度 1 {} {一般} 0.219 0.219 1.000 2 {} {货车-客车} 0.234 0.234 1.000 3 {} {追尾} 0.283 0.283 1.000 4 {} {货车-货车} 0.309 0.309 1.000 5 {} {安全距离不足} 0.380 0.380 1.000 6 {} {直线} 0.412 0.412 1.000 7 {} {>1 000} 0.430 0.430 1.000 8 {} {-2%~2%} 0.445 0.445 1.000 9 {} {货车} 0.456 0.456 1.000 10 {} {操作不当} 0.550 0.550 1.000 11 {} {碰撞} 0.639 0.639 1.000 12 {} {轻微} 0.662 0.662 1.000 13 {} {晴} 0.764 0.764 1.000 14 {} {财产损失事故} 0.829 0.829 1.000 15 {} {1~2辆} 0.903 0.903 1.000 16 {2%~3%} {财产损失事故} 0.106 0.834 1.006 17 {星期四} {财产损失事故} 0.113 0.858 1.036 18 {星期四} {1~2辆} 0.121 0.920 1.019 19 {星期五} {轻微} 0.103 0.751 1.134 20 {星期五} {晴} 0.108 0.787 1.031 21 {星期五} {1~2辆} 0.129 0.941 1.043 22 {星期二} {财产损失事故} 0.119 0.853 1.029 23 {>3%} {轻微} 0.125 0.874 1.320 24 {>3%} {晴} 0.122 0.852 1.116 25 {>3%} {1~2辆} 0.133 0.930 1.031 ⋮ ⋮ ⋮ ⋮ ⋮ ⋮
下载: 导出CSV
-
[1] WANG C Z, CHEN F, ZHANG Y, et al. Spatiotemporal instability analysis of injury severities in truck-involved and non-truck-involved crashes[J]. Analytic Methods in Accident Research, 2022, 34: 100214. doi: 10.1016/j.amar.2022.100214 [2] 李硕, 马玉坤, 韩晖, 等. 山区高速公路货车事故严重度致因及随机参数分析[J]. 公路交通科技, 2023, 40(4): 228-236.LI S, MA Y K, HAN H, et al. Analysis on causes and random parameters of truck accident severity in mountainous expressway[J]. Journal of Highway and Transportation Research and Development, 2023, 40(4): 228-236. (in Chinese) [3] 程国柱, 刚杰, 程瑞, 等. 公路货运通道路侧事故多发路段判别与线形设计[J]. 哈尔滨工业大学学报, 2022, 54(3): 131-138.CHENG G Z, GANG J, CHENG R, et al. Identification of roadside accident blackspot and geometrie design ofdedicated freight corridor on highways[J]. Journal of Harbin Institute of Technology, 2022, 54(3): 131-138. (in Chinese) [4] 柯星安, 赵丹, 王秋鸿, 等. 基于模型群的重型货车交通安全风险因素分析[J]. 交通信息与安全, 2024, 42(4): 72-80. doi: 10.3963/j.jssn.1674-4861.2024.04.008KE X A, ZHAO D, WANG Q H, et al. An analysis of risk factors of traffic safety for heavy trucks based on model group[J]. Journal of Transport Information and Safety, 2024, 42(4): 72-80. (in Chinese) doi: 10.3963/j.jssn.1674-4861.2024.04.008 [5] AHMED M M, FRANKE R, KSAIBATI K, et al. Effects of truck traffic on crash injury severity on rural highways in Wyoming using Bayesian binary logit models[J]. Accident Analysis & Prevention, 2018, 117: 106-13. [6] 公安部交通管理局. 道路交通事故统计年报[M]. 北京; 人民交通出版社. 2020.Traffic Management Bureau of the Ministry of Public Security. Road traffic accident statistical yearbook[M]. Beijing: People's Transportation Publishing House, 2020. (in Chinese) [7] HONG J, TAMAKLOE R, PARK D. Discovering insightful rules among truck crash characteristics using apriori algorithm[J]. Journal of Advanced Transportation, 2020 (1): 4323816. [8] DONG C J, DONG Q, HUANG B S, et al. Estimating factors contributing to frequency and severity of large truck-involved crashes[J]. Journal of Transportation Engineering, Part A: Systems, 2017, 143(8): 04017032. doi: 10.1061/JTEPBS.0000060 [9] WANG Y G, LUO Y, CHEN F Y. Interpreting risk factors for truck crash severity on mountainous freeways in Jiangxi and Shaanxi, China[J]. European Transport Research Review, 2019, 11(1): 26. doi: 10.1186/s12544-019-0366-4 [10] BEHNOOD A, MANNERING F. Time-of-day variations and temporal instability of factors affecting injury severities in large-truck crashes[J]. Analytic Methods in Accident Research, 2019, 23: 100102. doi: 10.1016/j.amar.2019.100102 [11] YANG C, CHEN M Y, YUAN Q. The application of XGBoost and SHAP to examining the factors in freight truck-related crashes: an exploratory analysis[J]. Accident Analysis & Prevention, 2021, 158: 106153. [12] MUHAMMAD I, LIU L, MUHAMMAD Z, et al. A comparative study of machine learning classifiers for injury severity prediction of crashes involving three-wheeled motorized rickshaw[J]. Accident Analysis & Prevention, 2021, 154: 106094. [13] CHEN F, CHEN S. Injury severities of truck drivers in single-and multi-vehicle accidents on rural highways[J]. Accident Analysis & Prevention, 2011, 43(5): 1677-1688. [14] PAHUKULA J, HERNANDEZ S, UNNIKRISHNAN A. A time of day analysis of crashes involving large trucks in urban areas[J]. Accident Analysis & Prevention, 2015, 75: 155-163. [15] HAQ M T, ZLATKOVIC M, KSAIBATI K. Investigating occupant injury severity of truck-involved crashes based on vehicle types on a mountainous freeway: a hierarchical Bayesian random intercept approach[J]. Accident Analysis & Prevention, 2020, 144: 105654. [16] 牛毅, 李振明, 樊运晓. 基于数据挖掘的高速公路货车交通事故影响因素关联分析研究[J]. 安全与环境工程, 2020, 27(4): 180-188.NIU Y, LI Z M, FAN Y X. Correlation Analysis of Influencing Factors of TruckTraffic Accidents on Expressways[J]. Safety and Environmental Engineering, 2020, 27(4): 180-188. (in Chinese) [17] ZHENG Z, LU P, LANTZ B. Commercial truck crash injury severity analysis using gradient boosting data mining model[J]. Journal of Safety Research, 2018, 65: 115-124. [18] 胥川, 谢琨, 杨迪, 等. 货车重量对事故严重程度的影响研究[J]. 交通运输工程与信息学报, 2019, 17(2): 10-15, 22.XU C, XIE K, YANG D, et al. Analysis the impact of truck weight levels on injury severity[J]. Journal of Transportation Engineering and Information, 2019, 17(2): 10-15, 22. (in Chinese) [19] UDDIN M, HUYNH N. Truck-involved crashes injury severity analysis for different lighting conditions on rural and urban roadways[J]. Accident Analysis & Prevention, 2017, 108: 44-55. [20] HAO W, KAMGA C, YANG X, et al. Driver injury severity study for truck involved accidents at highway-rail grade crossings in the United States[J]. Transportation Research Part F: Traffic Psychology and Behaviour, 2016, 43: 379-386. [21] NAIK B, TUNG L W, Zhao S, et al. Weather impacts on single-vehicle truck crash injury severity[J]. Journal of safety research, 2016, 58: 57-65. doi: 10.1016/j.jsr.2016.06.005 [22] WENG J, ZHU J-Z, YAN X, et al. Investigation of work zone crash casualty patterns using association rules[J]. Accident Analysis & Prevention, 2016, 92: 43-52. [23] CHEUNG D W, HAN J, NG V T, et al. A fast distributed algorithm for mining association rules[C]. The 4th International Conference on Parallel and Distributed Information Systems. IEEE, 1996. [24] SUN M, ZHOU R G, JIAO C W. Analysis of HAZMAT truck driver fatigue and distracted driving with warning-based data and association rules mining[J]. Journal of Traffic and Transportation Engineering (English edition), 2023, 10(1): 132-142. [25] YU S, JIA Y, SUN D. Identifying factors that influence the patterns of road crashes using association rules: a case study from Wisconsin, United States[J]. Sustainability, 2019, 11 (7): 1925. [26] 袁振洲, 娄晨, 杨洋. 时间差异条件下的高速公路交通事故致因分析[J]. 北京交通大学学报, 2021, 45(3): 1-7.YUAN Z Z, LOU C, YANG Y. Analysis of highway traffic accidents causes under time differences[J]. Journal of Beijing Jiaotong University, 2021, 45(3): 1-7. (in Chinese) [27] HAN J, PEI J. Mining frequent patterns by pattern-growth: methodology and implications[J]. ACM SIGKDD Explorations Newsletter, 2000, 2(2): 14-20. [28] HONG J, TAMAKLOE R, PARK D. Application of association rules mining algorithm for hazardous materials transportation crashes on expressway[J]. Accident Analysis & Prevention, 2020, 142: 105497. [29] HALEEM K, GAN A. Contributing factors of crash injury severity at public highway-railroad grade crossings in the US[J]. Journal of Safety Research, 2015, 53: 23-29. [30] 温惠英, 黄坤火, 赵胜. 基于机器学习的高速公路大型货车追尾风险预测[J]. 中国安全科学学报, 2023, 33(9): 173-180.WEN H Y, HUANG K H, ZHAO S. Prediction of rear-end collision risk of freeway trucks based on machine learning[J]. China Safety Science Journal, 2023, 33(9): 173-180. (in Chinese) [31] REZAPOUR M, MOOMEN M, KSAIBATI K. Ordered logistic models of influencing factors on crash injury severity of single and multiple-vehicle downgrade crashes: A case study in Wyoming[J]. Journal of Safety Research, 2019, 68: 107-118. -

 点击查看大图
计量
- 文章访问数: 17
- HTML全文浏览量: 10
- PDF下载量: 2
- 被引次数: 0