2022 Vol. 40, No. 4

Display Method:
A Review on Road Driving Safety Based on Driving Simulation Technologies
ZHANG Chi, WEI Dongdong, LAN Fu'an, BAI Hao, HUANG Jun
2022, 40(4): 1-12. doi: 10.3963/j.jssn.1674-4861.2022.04.001
Abstract(1191) HTML (357) PDF(772)
Abstract:
The current status and problems of the studies and applications of driving simulation technologies in the field of road traffic safety are analyzed. On the basis of extensive relevant literatures in China and abord, the driving simulators are classified. The development history of the typical driving simulators for scientific research is summarized, and the degrees of freedom, main features, and application areas of them are analyzed. With a main line of "human-vehicle-road-environment-accident", the current situations of the application studies, problems, and prospects are systematically analyzed from five aspects including risky driving behaviors, active safety technologies, road and traffic design, driving environment, and road traffic accidents. For the studies of risky driving behaviors, the identification of distracted and fatigue driving behaviors are analyzed with the application of driving characteristics. For the studies of active safety technologies, the vehicle cha ssis integrated control technology, safety-assisted driving control technology, and evaluation of take-over behaviors of automated driving are summarized. For the studies of road traffic design, the evaluation of geometric road design and traffic signs are analyzed. For the studies of driving environment, the effects of adverse weather, roadside views, and traffic conflicts are summarized. For the studies of road traffic accidents, the reproduction of accidents and influencing factors of traffic safety are analyzed. In addition, an application prospect of driving simulation technology is presented, mainly including driving behaviors of special groups, system testing of intelligent networked vehicles, and driving safety under the environment of mixed traffic flow. In order to better promote the development of driving simulation technology, the efficiency evaluation, discomfort, and secondary development of driving simulators will be studied in the future.
A Review on Research Status and Trends of Eco-driving on Intelligent Connected Vehicles
CHEN Zhijun, ZHANG Jingming, XIONG Shengguang, SU Zipeng, HU Junnan, WU Chaozhong
2022, 40(4): 13-25. doi: 10.3963/j.jssn.1674-4861.2022.04.002
Abstract(1250) HTML (501) PDF(762)
Abstract:
In recent years, eco-driving has become a major research focus within intelligent connected vehicles, aiming to effectively alleviate problems such as energy consumption and emission by improving driving behaviors, which attracts the great attention from governments, businesses, universities, and research centers. Meanwhile, with the rapid advancement of intelligent networked vehicles, the networked environment provides new development opportunities for eco-driving. To analyze the research progress of eco-driving on intelligent connected vehicles, the influencing factors are analyzed from four aspects compared with traditional eco-driving: vehicle characteristics, drivers' personality, road traffic conditions, and social environment. The existing studies on intelligent connected eco-driving are summarized from two aspects: eco-driving control strategies and current status of eco-driving applications. To provide useful guidance and references for future research, the significance, application, and current problems of eco-driving are also discussed from three aspects: influencing factors, control strategies, and decision optimization. The analysis results show that the influencing factors of eco-driving under intelligent connected environment or traditional environment are relatively similar; however, the networked sensors and communication conditions have greater impacts on eco-driving under the intelligent connected environment. Compared with traditional eco-driving, the control strategies and decision optimization for eco-driving under the intelligent connected environment consider more complex driving conditions, as well as global eco-driving at multi-vehicle levels. In addition, with the rapid growth of new technologies, combining advanced technologies and adapting them to the development of the industry will become an inevitable trend of eco-driving on intelligent connected vehicles in the future.
A Review on Railway Traffic Safety Under Harsh Environments
LI Decang, CHEN Xiaoqiang, MENG Jianjun, XU Ruxun, QI Wenzhe, ZHANG Zijian
2022, 40(4): 26-37. doi: 10.3963/j.jssn.1674-4861.2022.04.003
Abstract(1006) HTML (408) PDF(698)
Abstract:
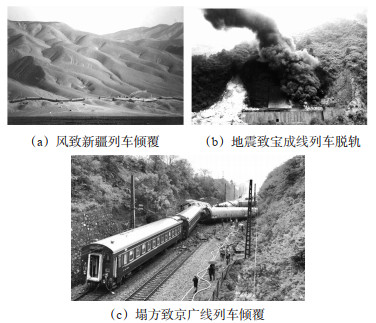
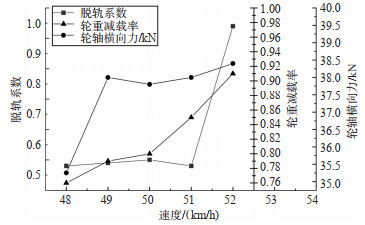
The harsh environments including strong sandstorm, earthquake, and debris flow seriously threaten the operation safety of trains. To study and prevention of railroad natural disasters, to ensure the safety operation of trains, to ensure the safe and smooth flow of transport has become a major task of railroad research. It has become a major task of railroad research to study and prevent natural disasters of railways, ensure the safety operation of trains, and guarantee smooth transportation. To prevent and avoid the accidents of train derailment or overturning caused by harsh environments, the mechanism of train derailment and dynamic characteristics, environmental measurement system, dispatching system, early-warning system, control system, experimental verification, and disaster prevention measures under harsh environments are reviewed. The classification and characteristics of harsh environments are summarized, and the impacts of different harsh environments on key aspects of safety operation of trains are analyzed according to the vehicle dynamics and safety performance indicators, under different harsh environments, road conditions, and for different types of trains. The corresponding safety control methods and measures for railway traffic safety in harsh environments (e.g. speed limits or emergency stops, de-icing devices for turnouts and pantographs, windbreak or wind barriers, monitoring and early warning systems, and traffic command systems, etc.), and the research methods adopted in the implementation of these methods and measures (e.g. theoretical analysis, numerical calculations, wind tunnel tests, and online driving simulations, etc.) are outlined. Moreover, it also looks forward to the research emphasis and development trend on the safety operation of railway trains under the harsh environment.
Optimization of the Transportation Network of Hazardous Materials Considering Bounded Rationality and Equity
ZHANG Honggang, WANG Wei, PAN Minrong, LIU Zhiyuan
2022, 40(4): 38-45. doi: 10.3963/j.jssn.1674-4861.2022.04.004
Abstract(875) HTML (319) PDF(653)
Abstract:
For the optimization of the transportation network of hazardous materials (hazmat) with risk control, the effects of route selection for hazmat carriers considering bounded rationality on transportation risk is studied. A bi-level programming model is developed based on a robust optimization method to achieve risk equity by increasing the upper bound constraint on the maximum link risk. In which, the upper level aims to minimize the maximum total risk of the transportation network, the upper bound value of maximum link risk, and the total number of link closures by closing quite a few links. The lower lever indicates that the hazmat carriers considering bounded rationality chose the route with minimum total cost considering perceptual errors. For the traditional heuristic algorithms easily fall into the local optimal solutions, a cutting plane algorithm is proposed to solve the model by redefining the problems of upper and lower levels, and finally a numerical example is given. The results show that, the total cost of hazmat carriers considering bounded rationality increases by 3.5%, but the maximum total risk of the transportation network of hazmat decreases by 8.4%. By changing the focus of government departments on each objective, boundedly rational route choice behaviors of hazmat carriers can be influenced. The variance coefficient and the Gini coefficient decrease by 36.1% and 26.2%, respectively, which results in achieving the goal of risk equity between different links. In a case of vehicle restriction strategy, a sensitivity analysis is carried out on the perceptual errors of hazmat carriers considering bounded rationality. It shows that the minimum value of the maximum total risk of the transportation network would not change, but has impacts on the total number of link closures. In the case that hazmat carriers are bounded rational decision makers, a more realistic transportation network for hazmat can be designed for government departments, thus effectively reducing transportation risks.
An Analysis of Occupant Death Risk of 5-Seater Cars in Two-vehicle Collisions
ZHAN Junjun, YUN Meiping, ZHANG Wei, DONG Yijia
2022, 40(4): 46-53. doi: 10.3963/j.jssn.1674-4861.2022.04.005
Abstract(745) HTML (338) PDF(655)
Abstract:
To study occupant death risk of 5-seater cars in two-vehicle collisions, the impacts of six variables on fatality rates are compared. Moreover, binary logistic regression is used to analyze the influences of different features and their combinations on occupant death risk. A model to forecast occupant death risk is developed based on a parameter adjustment method of GridSearchCV, three algorithms with larger F1 values are selected from nine classification algorithms, which are voting classifier, gradient boosting, and decision tree. The results show that: ① travel direction, type of road sections, type of crushed vehicles, and different seats have significant effects on occupant death risk. The occupant death risk increases by 72% when compared accidents including vehicles driving in opposite directions with that including vehicles driving in the same direction. The risk decreases by 69% when compared accidents occur at non-freeway intersections with that occur at freeway sections. The occupant death risks for commercial trucks and commercial buses are 5 times and 3 times higher than passenger cars, respectively. The risk rises to around 8 times and 15 times for non-freeway non-intersection sections and freeway sections, respectively. The death risk for passenger seats increased by 70% compared with that for driver seat, and the death risk for passenger seat is nearly 4 times higher than that for driver seat at freeway sections. ② Different vehicles and road-section types are the most important features affecting occupant death. ③ The proposed model indicates that if a commercial truck collides at the front or rear of a 5-seater car at freeway sections or non-freeway non-intersection sections, the occupants have higher risk of death than chance of survival.
Capacity of Mountainous Roads with Ice and Snow Pavement During Beijing Winter Olympics Based on a Safe Speed Model
GUO Yaming, LI Meng, LI Yunxuan, YAN Huimin, WANG Xiaoyan
2022, 40(4): 54-63. doi: 10.3963/j.jssn.1674-4861.2022.04.006
Abstract(800) HTML (288) PDF(644)
Abstract:
A novel challenge for traffic management is setting speed limits as well as guaranteeing road capacity under complex mountainous roads under the condition of ice and snow pavement. A safe speed model is proposed to solve this problem in Yanqing competition zone of Beijing Winter Olympics. The model studies relationships of safe speed, road alignment design, and adhesion coefficient, taking the safe speed as a basis to obtain the critical road capacity of mountainous roads under different conditions. A three-dimensional spatial model of mountainous road is developed by combining road horizontal curve, vertical curve, and cross section data. Based on the model, the forces acting on the vehicle in a mountainous road section of horizontal and vertical alignments is analyzed. The relationships between the safe speed and its influencing factors including radius of curves, road superelevation, downward slope, and adhesion coefficients of road is studied. The road capacity is analyzed based on the safe speed model. Two pavement conditions and two vehicle types are selected as case studies to obtain safe speeds on ice and snow pavement of mountain roads under different conditions. A total of 20 simulation scenarios are designed by VISSIM to verify the safe model. Combined with the actual traffic data, the simulation results show that compared with the traditional full speed limit model, the travel time of the developed model can reduce by 38% (car) and 32% (bus) with ice pavement; and reduce by 26% (car) and 24% (bus) with snow pavement. In addition, there is a phase transition from free flow to saturated flow in the traffic flow of mountainous road. The maximum road capacity for cars of the downward slope with ice pavement is 241 vehicles/h (one-way driving) and 231 vehicles/h (two-way driving); for buses is 227 vehicles/h (one-way driving) and 222 vehicles/h (two-way driving). The maximum road capacity for cars of the downward slope with snow pavement is 319 vehicles/h (one-way driving) and 249 vehicles/ h (two-way driving); for buses is 301 vehicles/h (one-way driving) and 236 vehicles/h (two-way driving).
A Collision Risk Model for Small UAVs Based on Velocity Random Distribution in Low-altitude Airspace
WANG Lili, YANG Jie
2022, 40(4): 64-70. doi: 10.3963/j.jssn.1674-4861.2022.04.007
Abstract(710) HTML (236) PDF(643)
Abstract:
Collision risk is a key indicator to evaluate the safety of aircraft and the main factor to determine the aircraft's operating conditions in the airspace. To handle the potential conflict due to the increasing number of small Unmanned Aerial Vehicles (UAVs) in low-altitude airspace, a novel collision risk model based on velocity random distribution is developed to determine the safe operating conditions of UAVs in low-altitude airspaces. New collision templates for UAVs are proposed, incorporating the maneuverability and flexibility of small UAVs. For a free-flying UAV, a double-layer sphere collision template is developed, including a collision layer and an avoidance layer. For a UAV following a fixed path, a cuboid collision template is proposed, incorporating the fuselage size of the UAV. Considering the rapid change of course and speed of the UAV, a stochastic velocity model is adopted instead of a linear model, and the relative velocity between UAVs is calculated, which is used to determine the space swept by the collision template. Considering positioning errors and speed errors of UAVs, the collision risk model based on velocity random distribution is proposed for UAVs in low-altitude airspace. Two types of UAVs, DJI M300 and M600, are selected as verification models. The Matlab software is used to simulate specific airspace scenarios. Then the relationships between collision risk and the density of small UAVs are analyzed. The simulations show that the collision risk in the airspace is positively correlated with the density of UAVs. According to the safety standards from the International Civil Aviation Organization, the maximum densities for the safe operation of the two types of verification models are 4.2 aircraft/km3 and 5.0 aircraft/km3, respectively. Under the premise of satisfying the safe conditions, the proposed model can increase the upper limit of the density of the two types of UAVs in the airspace by 106.9% and 88.7%, respectively. The results reveal that the proposed model is more consistent with the operating characteristics of UAVs. It can be used to improve the utilization of airspace, increase the capacity of UAVs in the airspace, and improve their operational efficiency in the future.
Real-time Forecast Models for Traffic Accidents on Expressways Using Stability Coefficients of Traffic Flow
LIU Xingliang, SHAN Jue, LIU Tangzhi, RAO Chang, LIU Tong
2022, 40(4): 71-81. doi: 10.3963/j.jssn.1674-4861.2022.04.008
Abstract(992) HTML (311) PDF(683)
Abstract:
Real-time forecast models for traffic accidents requires a large number of variables, which causes difficulties in data collection and decreases reliability of the model due to overfitting. Two interpretable variables, vertical and horizontal stability coefficients of traffic flow, are proposed to simplify the set of variables, which can facilitate the implementation of forecast models for traffic accidents and reduce the effects of overfitting. Three algorithms including support vector machine, random forest, and logistic regression are selected to develop real-time forecast models for traffic accidents on expressways, respectively. The experiments are conducted based on data of traffic accidents and historical traffic flow collected from the expressway G3001 in the city of Xi'an. In addition, the improved GI index is used to evaluate the significance of the proposed two stability coefficients of traffic flow. The effects of the two proposed coefficients on reducing overfitting is verified through comparing accuracies and AUC values of the set of variables in the test and training data.Besides, the computational efficiency is evaluated by the training time to verify the reliability of the developed models with the two coefficients. The results show that the improved GI indices of the models with horizontal and vertical stability coefficients of traffic flow are 0.952 and 0.922, respectively, which indicates that the proposed two coefficients are more significant for forecasting accidents on expressways than other variables. In the three models, the simplified set of variables based on the two coefficientshas prediction accuracy of 91.1% and 90.5%, respectively, in training and test data, which is similar to the original set of variables. The differences of average prediction accuracy between the simplified set of variables and the original set of variables are 0.69% and 4.87%, respectively. The difference of average AUC values between the two sets of variables are 1.61% and 5.87%, respectively. The average time cost of model training with the simplified set of variables decreases by 15.2%. Thus, the two proposed stability coefficients of traffic flow can improve both the reliability and the computational efficiency of the models.
Influences of Nighttime Supplemental Light for Road Monitoring on Driving Safety of Young Drivers
HUANG Qiong, JIAO Pengpeng, ZHAO Pengfei, WANG Jianyu
2022, 40(4): 82-91. doi: 10.3963/j.jssn.1674-4861.2022.04.009
Abstract(688) HTML (291) PDF(27)
Abstract:
To study the influences of nighttime supplemental light for road monitoring on young drivers, a simulation of urban road that consider light intensity and crossing behaviors of pedestrians are designed by the software of UC-win/Road. The simulation is carried out with a driving simulator. The visual, physiological, and driving operational characteristics of drivers are collected by an eye tracker and physiological instruments. The repeated measures variance (ANOVA) is applied to analyze the influences of variables on three characteristics of young drivers and their significance. The results reveal the following facts. ① Regardless of whether there are crossing behaviors of pedestrians, with the increase of light intensity, the gaze duration, change rate of pupil area, and electroencephalogram (EEG) (α+θ)/β of young drivers all decrease, while the growth rate of heart rate, brake pedal depth ratio, and braking response distance increase. It indicates that the increasing light intensity adversely affects the visual, physiological, and driving operation characteristics of young drivers. ② When there are crossing behaviors of pedestrians, the light intensity has a more obvious effect on the visual, physiological, and driving characteristics of young drivers. ③ When the light intensity is less than 50 lx, the change of EEG (α+θ)/β and driving operation indicators of young drivers are slow. When the light intensity is greater than 50 lx, the EEG (α+θ)/β significantly decreases, with a change rate greater than 10%, and the value is less than 3.70, indicating that the young drivers have emotional fluctuations and significantly increased alertness. Meanwhile the brake pedal depth ratio significantly increases (greater than 0.55), and the braking response distance exceeds 13.40 m, indicating that the young drivers' braking operation is stronger than the usual, their operation stability decreases, and the success rate of avoiding pedestrians is significantly reduced, which is not conducive to driving at night. Therefore, it is recommended that the light intensity of nighttime supplemental light for road monitoring should be less than 50 lx.
A Cooperative Lane Changing Strategy to Give Way to Emergency Vehicles with the Cooperative Vehicle Infrastructure System
HAO Wei, LIANG Cong, ZHANG Zhaolei, LYU Nengchao, YI Kefu
2022, 40(4): 92-100. doi: 10.3963/j.jssn.1674-4861.2022.04.010
Abstract(877) HTML (303) PDF(49)
Abstract:
A cooperative lane-changing strategy is proposed to reduce the time loss when emergency vehicles approaching to accident scenes, and reduce the impacts of emergency vehicle priority on other vehicles with the cooperative vehicle infrastructure system (CVIS). By adjusting the position of the downstream vehicles (DV), the emergency vehicles can efficiently pass the road sections. The DV and vehicles in the adjacent target lane are taken as control objects. A space-gap set for lane-changing of DV is determined according to the spacing and communication range of vehicles in adjacent lanes. Further, aiming to minimize the overall recovery time of traffic flow, the lane-changing trajectory of DV and the speed change of cooperative vehicles in the adjacent lanes are determined to guide vehicles to complete cooperative merging. It can not only guarantee the safety of the lane-changing behaviors, but also reduce the transmission of speed fluctuations caused by the lane-changing behaviors. For upstream vehicles (UV), the rule of first-in-first-out (FIFO) is used to reduce the time for recover from the speed fluctuations caused by lane-changing behaviors of DV. Considering the impacts of lane-changing on the traffic flow, a control method to reduce the transmission of speed fluctuations is proposed based on a classic lane changing strategy. The results of a case study show that the shortest lane-changing time is 6 s when using the proposed cooperative lane-changing strategy, and the corresponding distance of sending emergency signal is 78.66 m. Meanwhile, the results show that the time required to restore stability of speed is 29 s, which is 34% shorter than that without the cooperative lane-changing strategy.
Trajectory Prediction and Intention Identification of Ships in Confluence Waters
WANG Zhihao, YUAN Haiwen, LI Weina, XIAO Changshi
2022, 40(4): 101-109. doi: 10.3963/j.jssn.1674-4861.2022.04.011
Abstract(894) HTML (396) PDF(69)
Abstract:
A data-driven method is proposed for predicting ship trajectory and identifying sailing intention for typical confluence waters. A CNN+LSTM combined neural network is designed by learning the historical trajectories of the ships in the confluence waters. Using CNN+LSTM as an encoder, the spatio-temporal characteristics of the navigable environment and ship sailing are extracted. The decoder, which is composed of the LSTM and full connection layer, synchronously outputs the trajectory sequence and route selection of the ship in the future period. Moreover, the Dropout layer is introduced to describe the prediction uncertainty of the proposed model. Take the same trajectory sequence as the input, multiple groups of similar prediction results are obtained by randomly disabling several neural units of the CNN+LSTM network. Based on the statistical mean and variance of the prediction results, the prediction uncertainty of ship trajectory can be estimated. A dataset is created based on the open AIS data of confluence water in the coast of the United States. The input conditions are as follows: the input time is 60 min, the sam-pling frequency is 3 min, and the dropout parameter is 0.5. The results of the proposed model show that the error of trajectory prediction is 3.946 n mile for the next 60 min. The recognition accuracy of sailing intention is 87%. And the coverage rate of uncertainty estimation is 85.7%. Compared with other LSTM-based prediction methods, the trajectory prediction error of the proposed model is reduced by 31.6% when the ship's maneuverability changes. Furthermore, the proposed CNN+LSTM model has the ability of identifying ships' sailing intentions and estimating the prediction uncertainties, which is conducive to the development of intelligent navigation and intelligent maritime supervision technology.
An Analysis of Operating Characteristic of Vehicles at Signalized Road Intersections in Mountainous Cities Based on Aerial Video Data
ZHANG Gaofeng, LIU Xiaoming, SHANG Yanyu, XU Jin
2022, 40(4): 110-118. doi: 10.3963/j.jssn.1674-4861.2022.04.012
Abstract(599) HTML (281) PDF(23)
Abstract:
In order to identify operating characteristics of vehicles approaching signalized intersections in mountainous cities and their influencing factors, aerial video data of the traffic are captured at four signalized intersections in a mountainous city by drones. The operating characteristics of vehicles are extracted by AI video analysis from DataFromSky cloud platform. Based on a time-space diagram and the obtained data, the statistics of delay value, time headway and space headway before stop lines of straight lanes at intersections are calculated. Moreover, the correlations between the space headway, speed of a vehicle passing through the stop line, and average gradient of road are analyzed. The results show that the operating characteristics of a vehicle vary with its position in a queue. Furthermore, even with the same position in a queue, the operating characteristics of a vehicle still vary with different road sections. When waiting behind a stop line, the distribution of stop positions of vehicles closer to the stop line is more concentrated than that farther from it. The overall distribution of stop positions of vehicles is more dispersed in downhill sections than that in uphill sections. No matter it is an uphill section, a downhill section, or a gentle slope, the distribution of delay at a location closer to the stop line is larger than that at a location farther from it, and the maximum value of delay appears in the downhill sections. The distribution of time headways is concentrated at 1.5 s for all types of road sections, and it is more dispersed in uphill sections than that in downhill sections or gentle slopes, but the maximum value of time headways in uphill sections is smaller than that in downhill sections or gentle slopes. The distribution of space headways is concentrated at 10 m for all types of road sections, and it is skewed to the left in uphill and downhill sections, while that is more symmetric and concentrated to the mean value in gentle slopes. For all types of road sections, there is a strong positive correlation between space headway and the speed of a vehicle passing through the stop line. Besides, there is a positive correlation between average gradient of road and space headway of adjacent vehicles.
A Matching Method for Longitudinal Cracks Based on Curvature Similarity
CHEN Shi, HUANG Yuchun
2022, 40(4): 119-127. doi: 10.3963/j.jssn.1674-4861.2022.04.013
Abstract(682) HTML (232) PDF(19)
Abstract:
Pavement cracks captured byon-board cameras are distributed randomly in shapes, and only a part of the longitudinal cracks on the roads can be captured each timedue to the limited field of view, resulting in incomplete detection of longitudinal cracks. The imagesacquired by the on-board cameras are transformed from oblique images intoorthographic images by using the inverse perspective transformation method, thus the perspective distortionof the longitudinal cracks are corrected. Then a deep learning based semantic segmentation network, Deeplab V3+, is used to extract the pixels of cracks. Based on curvature similarity, a two-stage method from coarse to fineis proposed for matching longitudinal cracks.The crack curve to be matched is divided into a sequence of overlapping sub-curves, which are characterized by descriptor of curvature, and the matched sub-curves are the matched parts of cracks. The curvature is used to express the local shape and trend features of sub-curvesas descriptors, then the Kd-tree nearest neighbor matching algorithm is used to perform coarse and fast matching of thedescriptors. According to the spatial distribution of longitudinal cracks in two consecutive road images, constraints are added when the crack curves are divided into sub-curves, the starting point of the crack curve in previousimage and the ending point in the next image areused asterminus of each respective sub-curve. Based on the results of coarse matching, the interval of segmentation curves is gradually reduced, and the normalized cross-correlation coefficient is iteratively improved until it is greater than or equal to the threshold or the number of iterations exceeds the maximum value to achieve fine adjustment of the results of coarse matching. To verify the accuracy of the algorithm, a case study is carried out with different types of continuous and longitudinal cracks on the campus roads of Wuhan University.The minimum error of the matching results can reach 0.688 pixels. Compared with the coarse matching, the error after fine adjustmentreduces by 24.19% on average. In order to further verify the stability of the algorithm under noise, crack pixel noise is added to the simulation environment.When the standard deviation of Gaussian noise increases from 0 to 2 pixels, the error of the matching results increases by only 1.083 pixels. Compared with the SIFT algorithm, the proposed method can achieve successful matching in all ten groups of experiments, while the matching results of the SIFT algorithm completely fails in two groups. It indicates that the algorithm proposed has better stability under normal and noise environment.
A Prediction Model for Operation Speed of Six-axis Articulated Trains in Uphill Sections of Expressways
ZHANG Chi, HU Ruilai, XIANG Delong, ZHANG Hong, ZHANG Min
2022, 40(4): 128-137. doi: 10.3963/j.jssn.1674-4861.2022.04.014
Abstract(724) HTML (263) PDF(27)
Abstract:
The prediction error of operation speed of 6-axis articulated trains in uphill sections of expressways is large, and its safe operation management is challenging. An Operation Speed Prediction Model (OSPM) is proposed to address this issue. Radars and AxleLight side lasers are used to collect the traffic flow data of six-axis articulated trains at five continuous uphill sections of an expressway from Southwest China. Moreover, the actual operation speed is compared with the results from an existing standard prediction model. Then the OSPM for six-axis articulated trains in uphill sections of expressways is developed by taking the gradient and the length of the uphill, the specific power, and the initial speed of the trains as variables. Lastly, an error correction method is developed, and effectiveness of the proposed method is analyzed. The main results are shown as follows: the average rate of prediction error of the standard model reaches 25.37%, and the prediction error is relatively significant. The operation speed is negatively correlated to the gradient and the length of uphill, while it is positively correlated to specific power of the train. The goodness of fit of multiple linear regression model R2 is 0.978, meeting the test requirement. The difference between the predicted speed and the actual speed is in the range of 2-4 km/h, and the average relative error is 8.86%, which is 16.51% less than the standard model. Considering the influences of traffic density, the revised model can reduce the error within 1 km/h; the average relative error is 1.08%, which is 7.78% less than the original model and 24.29% less than the standard model. These results reveal that the proposed OSPM can considerably improve the accuracy of the operation speed prediction.
An Evaluation and Analysis on the Resilience of the Urban Local Road Network for Recurrent Congestions
CHEN Siyu, LI Jie, HU Yancheng, JIANG Yu
2022, 40(4): 138-147. doi: 10.3963/j.jssn.1674-4861.2022.04.015
Abstract(938) HTML (323) PDF(50)
Abstract:
To alleviate the state of urban noise, energy consumption, and carbon emission caused by recurrent traffic congestions, and to improve the ability to resist impacts of a short-term surge in traffic flow, macroscopic fundamental diagrams and performance profiles are combined to quantify the resilience of the urban local road network. Five evaluation indices, including robustness index, ratio of loss areas, rapid recovery, difference of peak flows, and difference of critical densities, are proposed to reflect characteristics of the resilience in the stages of performance degradation, stability, and recovery. The Kendall method is used to test the consistency of each weighting method, and the optimal weight is obtained based on the CRITIC for multi-attribute decision making. Furthermore, a combined method using weighting method and fuzzy logic is proposed to evaluate the resilience of the urban local road network, and the resilience score is graded by the Likert scale. Taking a local road network in the city of Changsha as a case study. Improvement schemes for the resilience are designed, and schemes of traffic signal timing are carried out and optimized to improve the resilience of recurrently congested intersections on key road sections. The evaluation indices of the resilience of the local road network are calculated based on the outputs of VISSIM simulations. The results show that scheme 8, 10, and 16 can effectively absorb the short-term surge in traffic flowand adapt to traffic states on the road network. The scheme 14 has the best performance out of all schemes. The comprehensive resilience score of the urban local road network presents an upward trend of non-linear growth with the increasing number of signal optimized sections. The optimization of traffic signal timing improves resilience properties of the local road network, and then reduces the negative impacts of some key sections on the resilience of urban local road network. Besides, different methods for evaluating the resilience make distinct ranking results.The ranking results based on difference of peak flows are more similar to the results of vulnerability indices, while the ranking results based on ratio of loss areas are more similar to the results of loss of resilience. The proposed evaluation indices, not confined to a single attribute of resilience, can reflect the response process of road network under disruption more comprehensively and objectively.
A Dispatch Strategy for Shared Bicycles Based on a Levels-of-Detail Model
HU Zhenghua, ZHOU Jibiao, ZHOU Hanlin, ZHANG Minjie
2022, 40(4): 148-156. doi: 10.3963/j.jssn.1674-4861.2022.04.016
Abstract(818) HTML (315) PDF(21)
Abstract:
As an important part of urban public transportation, the shared bicycles have played a positive role in relieving traffic congestion and promoting a low-carbon, environmentally friendly travel system. However, people often encounter difficulties with borrowing or returning a bicycle when tending to use shared bicycles, due to the uneven temporal and spatial distributions of the demands of borrowing and returning bicycles. Such difficulties sometimes make travelers give up using shared bicycles. In order to effectively improve the success rate of borrowing and returning bicycles, a dispatch strategy based on a levels-of-detail model is proposed. First, based on the similarity among bicycles stations, a spectral clustering algorithm is adopted to hierarchically classify the areas where stations locate. Thus, station clusters are formed based on station scopes (i.e., the geographic spatial area of a public station occupied). Second, the total demand of borrowing/returning bicycles among different station clusters at each level is counted, and a genetic algorithm is adopted to solve the transport route for dispatch vehicles. Third, the dispatch strategies at each level are overlaid to form a dispatch strategy for shared bicycles with the granularity from coarse to fine. Compared with the traditional methods, the proposed strategy reduces the total length of dispatch path by 42.70%, and therefore the corresponding dispatch time can also be shortened accordingly.
An Analysis of Trajectory Streamline and Curvature Characteristics of Right-turn Vehicles at Urban Arterial Road Intersections
DAI Zhenhua, LIAO Qishuo, PAN Cunshu, SHANG Yanyu, XU Jin
2022, 40(4): 157-166. doi: 10.3963/j.jssn.1674-4861.2022.04.017
Abstract(745) HTML (266) PDF(15)
Abstract:
A drone was used to take high-altitude images of four urban road intersections in Chongqing to study the trajectory characteristics and curvature patterns of right-turn vehicles at urban arterial road intersections. The trajectory data of right-turn vehicles, including time, driving speed, and trajectory coordinates, are collected by using image analysis methods, based on which the trajectory curvature of vehicles is obtained by calculating the radius of circumcircle of adjacent trajectory points. The relationship between the distribution of passing positions of right-turn vehicles and the geometric layout of intersections is analyzed by using the distance between the trajectory line and the curb line, and the trajectory characteristics of right-turn vehicles at the intersections are further studied. Six types of curvature patterns of the trajectories of right-turn vehicles are identified based on a clustering method, and common driving behaviors under different curvature patterns are determined, and the relationship between vehicle speed and trajectory curvature is finally investigated. The results reveal the following conclusions. ① The geometric layout (including the curb radius, lane width, and the number of exit lanes) has impacts on the distribution of trajectories of right-turn vehicles. ②Right-turn lanes with channelized design can limit the distribution of trajectories and reduce conflicts and delays in right-turn traffic. ③ During a process of right-turning, more lateral space is required by buses than by cars, and the distribution of trajectories is less discrete. ④The key points of trajectory curvature are inconsistent with the trends of the main points in the circular curve design. ⑤ The acceleration of a vehicle has a negative correlation with the change rate of the trajectory curvature, and the correlation coefficient is -0.8435. ⑥ The driving speed has a positive correlation with the equivalent radius: the faster the vehicle moves, the larger the equivalent radius of the trajectory in the circular curve.
An Evaluation of Connectivity of Transfer in Comprehensive Passenger Transport Hubs Considering Social Distance
KONG Ao, XU Yaofang, DUAN Liwei, MA Qinglu
2022, 40(4): 167-176. doi: 10.3963/j.jssn.1674-4861.2022.04.018
Abstract(826) HTML (283) PDF(17)
Abstract:
In order to reduce the risk of the spread of the COVID-19 in comprehensive passenger transport hubs, passengers are required to maintain a certain social distance. In response to the lack of literatures regarding the influences of keeping social distance on connectivity of transfer in the transport hubs, an improved index systemis proposed to reflect the impacts of keeping social distance by introducing an index of riskof epidemic spreading (the higher the value of the index, the lower the risk of epidemic spreading). Specifically, the CRITIC-entropy weight method is used to calculate the weight of each index, and the TOPSIS evaluation model is used to analyze the connectivity of transfer in comprehensive passenger transport hubs with different social distances. Taking Chongqing West Railway Station as a case study, the corresponding connectivity of transfer is simulated by Anylogic software, then the value of each evaluation indexis output. The results reveal the following conclusions. First, indices including the number of over-density points of average passengers flow, queuing time atstation entrances, entry time, and entry rate have significant effects on the evaluation of passengers' transfer in comprehensive passenger transportation hubs. Second, thesocial distance for optimal connectivity of transfer is 1 m, comparing to the social distance of 2, 1.5, and 0 m, its comprehensive evaluation level of connectivity increases by 60.53%, 34.50%, and 25.71%, respectively. In detail, the values of indices of entry-exit time and efficiency averagely increase by 20.86% and 47.79%, respectively. The value of index ofrisk of epidemic spreading averagely increases by 53.74%. Third, when no social distance restriction is imposed, the comprehensive evaluation level of connectivity averagely decreases by 7.77%, and the values ofindices of entry-exit times and efficiencies increase by 47.08% and 60.00%, respectively, while the value of index of risk of epidemic spreading is 70.09% lower on average.
A Short-term Prediction of Air Traffic Flow Based on a Wavelet-optimized GRU-ARMA Model
YAN Shaohua, XIE Xiaoxuan, ZHANG Zhaoning
2022, 40(4): 177-184. doi: 10.3963/j.jssn.1674-4861.2022.04.019
Abstract(837) HTML (340) PDF(44)
Abstract:
A short-term prediction of air traffic flow is important for air traffic management, and effectively reduce traffic congestion.To improve the accuracy of the short-term prediction and reduce the workload of air traffic controllers, a wavelet-optimized GRU-ARMA based model is proposed.Based on traditional prediction methods, the originaldata of air traffic flow is decomposed by multi-scale wavelet transform. The detailed features of traffic flow with different frequenciesare extracted. Moreover, by using wavelet transform, component at low frequencies is subdivided as trend term, and time at high frequencies as noise term.Among them, the trend term represents the overall evolution trends of air traffic flow over time, while the noise term describes the comprehensive influences of random factors on air traffic flow. The gated recurrent unit (GRU) neural network and the autoregressive moving average (ARMA) model are used to predict the trend and noise terms, respectively.The prediction values of trend and noise terms are superimposed to obtain the final value of short-termprediction. An error analysis shows that the method maintains a stable prediction of about 2% at each prediction point. In contrast, the models that directly use raw traffic data for prediction (i.e. GRU, BiLSTM, CNN-LSTM neural network models) and the single ARMA model have prediction errors ranging from 5% to 37.14%.Compared to the GRU, BiLSTM and CNN-LSTM neural network models, the prediction accuracy of the proposed model is increased by 3.02%, 5.39% and 5.05%, respectively.