

A Method for Predicting Carbon Emission of Railway Transportation System Based on an LSTM Network with Dynamic Input via Sliding Window
-
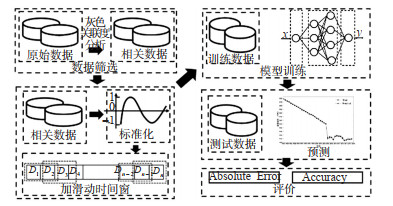
摘要: 铁路运输的低碳发展对交通系统实现“双碳”战略目标有着重要意义。针对当前铁路运输碳排放预测研究较少、预测精度不高的问题,考虑碳排放时间序列数据中历史信息和当前信息间的相关性,引入滑动窗口,结合长短期记忆(LSTM)网络,构建铁路运输碳排放量预测模型。采用灰色关联分析法计算铁路运输碳排放量各影响因素的关联度值,筛选铁路运输碳排放量的关键影响因素,使用高关联性数据作为预测模型的输入变量,提高预测精度;应用LSTM网络为基础预测模型,通过引入滑动窗口改进神经网络的数据输入; 考虑未来减排政策变化对铁路运输碳排放量的影响,融合基于动态政策的情景分析,构建铁路碳排放预测模型,并利用多项式误差拟合方法进行误差修正,提高预测结果准确性。以1980—2019年铁路运输碳排放相关数据为例,从现有文献中总结出17个铁路碳排放影响因素,利用灰色关联分析法从中筛选出6个关键因素,通过滑动窗口对筛选出的数据进行子序列分割,测试不同长度窗口下的预测精度,选择最优窗口参数,建立改进LSTM模型进行预测,并将预测结果与原LSTM、BPNN和RNN模型进行对比,结果表明:改进LSTM模型将相对误差平均值降低至0.392%,而原LSTM模型为3.862%,BPNN模型为1.535%,RNN模型为0.760%,即改进LSTM模型具有更高预测准确性;根据历史趋势和发展政策设置基准情景和3种未来减排情景,利用改进LSTM模型预测未来10年铁路运输碳排放量,在4种模拟情景下,铁路运输2030年的碳排放量分别为9.83×10⁶ t、8.91×10⁶ t、8.62×10⁶ t和8.09×10⁶ t。综上所述,引入滑动窗口的改进LSTM模型能进一步提高铁路运输碳排放量预测准确性,融合动态政策的情景分析可为未来铁路运输低碳发展提供可行路径。Abstract: Low-carbon development of railway is significant for the entire transportation system to achieve the goals of carbon peaking and carbon neutrality. Currently, there are a few studies on the methods for predicting carbon emission of railway transportation system, and their prediction accuracy is, in general, low. To improve the accuracy of corresponding prediction methods, considering the relationship between the historical and present information in the carbon emission time series data, a sliding window algorithm is integrated into a long short-term memory (LSTM) network to develop a prediction model for railway transportation system. A Grey Relation Analysis method is used to select the key factors with a higher correlation. The data highly correlated with the key factors identified are used as the input variables of the prediction model to improve the accuracy of the LSTM network. In addition, it is found that, by integrating a sliding window, the input of the network has been significantly improved. To study the impacts of future emission reduction policies on carbon emissions of railway transportation, the prediction model is used to analyze various policies under different scenarios. A polynomial error fitting method is used for error correction to improve the model accuracy. The data on carbon emissions from railway transportation from 1980 to 2019 are taken as the case study. Six key factors are identified and then selected from seventeen influencing factors of railway carbon emission that are reported in the literature, by using a Grey Relation Analysis. Then selected data is segmented into subsequences by the sliding window. The prediction accuracy under different window lengths is compared to select the optimal window parameters for the improved LSTM model. The improved LSTM model obtained is then compared with the original LSTM, BPNN, and RNN models. Study results show that the improved LSTM model reduces the average relative error to 0.392%, while that of the original LSTM model is 3.862%, the BPNN model 1.535%, and the RNN model 0.760%. Compared to these traditional models, the improved LSTM model consistently presents a higher accuracy. According to historical trends and development policies, a baseline scenario and three future emission reduction scenarios are set. The improved LSTM model is used to predict the carbon emissions of railway transportation in the next decade. Under the four scenarios, the carbon emissions of railway transportation in 2030 is 9.83×10⁶ t, 8.91×10⁶ t, 8.62×10⁶ t, and 8.09×10⁶ t, respectively. In summary, the improved LSTM model with sliding window can further improve the prediction accuracy of carbon emissions for railway transportation, and the scenario analysis based on various policy assumptions can provide a feasible path for future low-carbon development of railway transportation.
-

图 5 铁路碳排放与其影响因素相关度
Figure 5. Correlation between railway carbon emission and its influencing factors

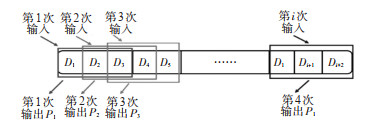
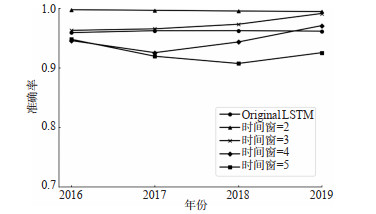
图 6 加入滑动时间窗前后及不同步长精度对比
Figure 6. Comparison of accuracy before and after adding sliding time window and different steps

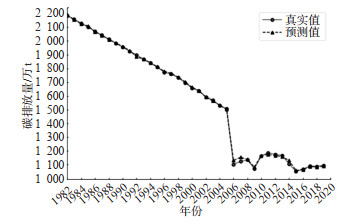
图 7 LSTM模型预测值与真实值对比
Figure 7. Comparison between predicted value and real value of LSTM model

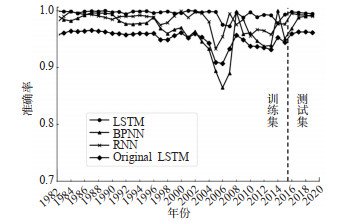
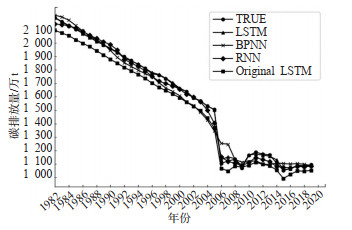
图 9 预测值对比实验结果
Figure 9. The predicted values are compared with the experimental result

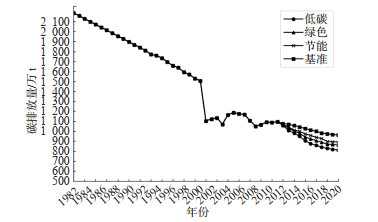
图 10 4种情景模式下铁路运输碳排放预测值
Figure 10. Carbon emission prediction of railway transportation under four scenarios
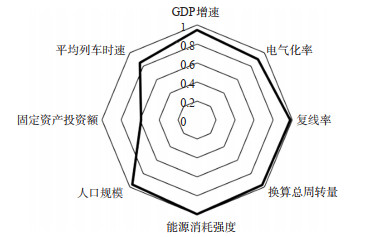
表 1 铁路碳排放影响因素数据
Table 1. Data on Influencing Factors of railway carbon emission
年份 碳排放量/×104t GDP增速 电气化率/% 复线率/% 换算总周转量/×108km 能源消耗强度/(t·10-4元) 总人口/×104人 固定资产投资/(×108元) 列车平均车速/(km/h) 1980 2 244.75 0.12 3.3 15.7 7 100 30.12 98 705 1981 2 215.82 0.08 3.3 16.5 7 185 29.24 100 072 1982 2 186.89 0.09 3.4 17.1 7 695 26.57 101 654 1983 2 157.96 0.12 4.2 17.8 8 422 23.15 103 008 1984 2 129.03 0.21 5.5 18.7 9 294 18.83 104 357 1985 2 100.10 0.25 8.0 19.2 10 542 15.43 105 851 40.0 1986 2 071.17 0.14 8.4 20.2 11 352 13.61 107 507 40.0 1987 2 042.24 0.17 9.4 21.3 12 315 12.32 109 300 40.0 1988 2 013.31 0.25 10.9 22.3 13 138 11.73 111 026 40.0 1989 1 984.39 0.13 12.0 23.6 13 407 10.16 112 704 40.0 1990 1 955.46 0.10 13.0 24.4 1 3211 7.62 114 333 40.0 1991 1 926.52 0.17 14.6 25.0 13 772 6.96 115 823 40.0 1992 1 897.59 0.24 15.8 25.5 14 696 6.45 117 171 40.0 1993 1 868.66 0.31 16.6 26.6 15 402 5.88 118 517 48.1 1994 1 839.73 0.36 16.6 28.7 16 059 5.29 119 850 48.1 1995 1 810.59 0.26 17.8 31.0 16 378 4.83 121 121 48.1 1996 1 771.82 0.17 17.8 32.5 16 243 4.11 122 389 48.1 1997 1 759.86 0.11 20.9 33.1 16 589 3.64 123 626 54.9 1998 1 734.48 0.07 22.5 34.2 15 952 3.26 124 761 562.42 55.2 1999 1 695.72 0.06 24.2 36.1 16 624 2.96 125 786 566.46 55.2 2000 1 657.35 0.11 25.3 36.5 17 750 2.64 126 743 517.40 61.6 2001 1 638.28 0.11 28.6 38.3 18 886 2.40 127 627 509.30 61.6 2002 1 592.80 0.10 29.2 38.7 19 881 2.16 128 453 623.52 61.6 2003 1 569.94 0.13 29.9 39.2 21 098 1.86 129 227 482.54 61.6 2004 1 530.35 0.17 30.4 39.1 23 797 1.49 129 988 516.32 65.7 2005 1 505.80 0.16 31.2 39.4 25 366 1.29 130 756 1 364.31 65.7 2006 1 103.55 0.17 37.0 39.8 26 910 0.82 131 448 2 075.97 65.7 2007 1 123.15 0.23 37.8 40.5 29 008 0.76 132 129 1 789.99 70.18 2008 1 134.92 0.18 39.1 41.6 31 388 0.69 132 802 3 375.54 70.18 2009 1 070.36 0.09 46.2 43.8 31 490 0.59 133 450 7 875.60 200.0 2010 1 163.99 0.18 49.4 44.8 36 406 0.59 134 091 8 426.52 200.0 2011 1 187.58 0.18 52.0 45.2 39 078 0.56 134 735 4 610.84 200.0 2012 1 174.44 0.10 53.5 46.2 38 999 0.43 135 404 6 339.67 200.0 2013 1 167.81 0.10 54.0 47.8 39 769 0.32 136 072 6 657.45 200.0 2014 1 107.24 0.09 58.0 48.6 39 134 0.31 136 782 8 088.00 200.0 2015 1 051.54 0.07 61.2 53.5 35 714 0.30 137 462 8 238.00 200.0 2016 1 066.37 0.08 64.7 54.9 36 371 0.30 138 271 8 015.00 200.0 2017 1 089.94 0.11 64.8 56.5 40 419 0.26 139 008 8 010.00 200.0 2018 1 088.22 0.10 71.9 59.0 43 074 0.23 139 538 8 028.00 200.0 2019 1 095.30 0.08 72.8 59.5 44 888 0.20 140 005 7 819.00 200.0 注:数据来源于《铁道统计公报》《中国统计年鉴》《中国能源统计年鉴》。  下载: 导出CSV
表 2 各因素与碳排放间关联度
Table 2. Correlation between various factors and carbon emission
名称 关联度 GDP增速 0.948 电气化率 0.906 复线率 0.980 换算总周转量 0.969 能源消耗强度 0.993 人口规模 0.963 固定资产投资额 0.590 平均列车时速 0.852
下载: 导出CSV
表 3 测试集预测值及评价指标
Table 3. Predicted value and evaluation index of test set
年份 真实值 预测值 相对误差 平均误差 2016 1 066.370 1 063.856 0.002 35 0.003 92 2017 1 089.940 1 086.284 0.003 35 2018 1 088.220 1 083.276 0.004 54 2019 1 095.300 1 089.344 0.005 43
下载: 导出CSV
表 4 对比试验相对误差值
Table 4. Comparative test relative error value
年份 真实值 LSTM BPNN RNN Original LSTM 预测值 误差 预测值 误差 预测值 误差 预测值 误差 2016 1 066.37 1 063.856 0.002 35 1 100.017 0.031 55 1 071.493 0.004 80 1 022.777 0.040 88 2017 1 089.94 1 086.284 0.003 35 1 103.280 0.012 23 1 081.811 0.007 45 1 130.951 0.037 63 2018 1 088.22 1 083.276 0.004 54 1 099.085 0.009 98 1 079.667 0.007 86 1 047.345 0.037 56 2019 1 095.30 1 089.344 0.005 43 1 086.927 0.007 64 1 084.019 0.010 30 1 137.381 0.038 42 平均误差 0.003 91 0.015 35 0.007 60 0.038 62
下载: 导出CSV
表 5 2020—2030年各因素发展速率
Table 5. Development rate of various factors from 2020 to 2030
单位: % 变化率 GDP增速 电气化率 复线率 换算总周转量 能源消耗强度 人口规模 中 2 4 4 3 -8 0.05 强 1 6 6 2 -10 0.01
下载: 导出CSV
表 6 铁路碳排放的情景模式
Table 6. Scenario of railway carbon emission
情景模式 GDP增速 电气化率 复线率 换算总周转量 能源消耗强度 人口规模 基准模式 中 中 中 中 中 中 节能模式 中 强 强 中 中 中 绿色模式 强 中 中 强 强 强 低碳模式 强 强 强 强 强 强
下载: 导出CSV
-
[1] 曾静静. 中美气候变化联合声明为国际应对气候变化行动注入新活力[J]. 地球科学进展, 2014, 29(12): 13-24. https://www.cnki.com.cn/Article/CJFDTOTAL-DXJZ201412003.htmZENG J J. China US joint statement on climate change injects new vitality into international action against climate change[J]. Progress in Geosciences, 2014, 29(12): 13-24. (in Chinese) https://www.cnki.com.cn/Article/CJFDTOTAL-DXJZ201412003.htm [2] 王文琳. 中国省域交通运输碳排放强度的影响因素及空间收敛性研究[D]. 西安: 长安大学, 2019.WANG W L. Study on influencing factors and spatial convergence of carbon emission intensity of provincial transportation in China[D]. Xi'an: Chang'an University, 2019. (in Chinese) [3] LIN B L, LIU C, WANG H J, et al. Modeling the railway network design problem: A novel approach to considering carbon emissions reduction[J]. Transportation Research Part D: Transport and Environment, 2017, 56(10): 95-109. [4] GONZALEZ P F, LANDAJO M, PRESNO M J. Tracking European Union CO2 emissions through LMDI (logarithmic-mean Divisia index)decomposition. The activity revaluation approach[J]. Energy, 2014, 73(8): 741-750. [5] 王勇, 韩舒婉, 李嘉源, 等. 五大交通运输方式碳达峰的经验分解与情景预测: 以东北三省为例[J]. 资源科学, 2019, 41 (10): 1824-1836. doi: 10.18402/resci.2019.10.06WANG Y, HAN S W, LI J Y, et al. Empirical decomposition and scenario prediction of carbon peak of five transportation modes: Taking the three northeastern provinces as an example[J]. Resource Science, 2019, 41(10): 1824-1836. (in Chinese) doi: 10.18402/resci.2019.10.06 [6] 张宏钧, 王利宁, 陈文颖. 公路与铁路交通碳排放影响因素[J]. 清华大学学报(自然科学版), 2017, 57(4): 443-448. doi: 10.16511/j.cnki.qhdxxb.2017.25.019ZHANG H J, WANG L N, CHEN W Y. Influencing factors of carbon emissions of highway and railway transportation[J]. Journal of Tsinghua University(Natural Science Edition), 2017, 57(4): 443-448. (in Chinese) doi: 10.16511/j.cnki.qhdxxb.2017.25.019 [7] LV Q, LIU H, YANG D, et al. Effects of urbanization on freight transport carbon emissions in China: Common characteristics and regional disparity[J]. Journal of Cleaner Production, 2019, 211: 481-489. doi: 10.1016/j.jclepro.2018.11.182 [8] 汪莹, 高佳钰, 雷雨轩. 我国铁路运营碳排放影响因素研究[J]. 铁道学报, 2020, 42(4): 7-16. doi: 10.3969/j.issn.1001-8360.2020.04.002WANG Y, GAO J Y, LEI Y X. Research on the influencing factors of carbon emissions from railway operation in China[J]. Journal of Railway Society, 2020, 42(4): 7-16. (in Chinese) doi: 10.3969/j.issn.1001-8360.2020.04.002 [9] 左大杰, 戴文涛. 基于通径分析的四川省交通碳排放驱动机理研究[J]. 交通运输系统工程与信息, 2018, 18(2): 230-235. https://www.cnki.com.cn/Article/CJFDTOTAL-YSXT201802034.htmZUO D J, DAI W T. Research on the driving mechanism of transportation carbon emissions in Sichuan province based on path analysis[J]. Transportation System Engineering and Information, 2018, 18(2): 230-235. (in Chinese) https://www.cnki.com.cn/Article/CJFDTOTAL-YSXT201802034.htm [10] 王靖添, 马晓明. 中国交通运输碳排放影响因素研究——基于双层次计量模型分析[J]. 北京大学学报(自然科学版), 2021, 57(6): 1133-1142. https://www.cnki.com.cn/Article/CJFDTOTAL-BJDZ202106015.htmWANG J T, MA X M. Research on the influencing factors of carbon emissions in china's transportation——based on two-level econometric model analysis[J]. Journal of Peking University (Natural Science Edition), 2021, 57(6): 1133-1142. (in Chinese) https://www.cnki.com.cn/Article/CJFDTOTAL-BJDZ202106015.htm [11] 卞利花, 吉敏全. 青海交通碳排放影响因素及预测研究[J]. 生态经济, 2019, 35(2): 35-39. https://www.cnki.com.cn/Article/CJFDTOTAL-STJJ201902009.htmBIAN L H, JI M Q. Research on influencing factors and predictions of carbon emissions from transportation in Qinghai[J]. Ecological Economy, 2019, 35(2): 35-39. (in Chinese) https://www.cnki.com.cn/Article/CJFDTOTAL-STJJ201902009.htm [12] 洪竞科, 李沅潮, 蔡伟光. 多情景视角下的中国碳达峰路径模拟: 基于RICE-LEAP模型[J]. 资源科学, 2021, 43 (4): 639-651.HONG J K, LI Y C, CAI W G. Simulation of china's carbon peaking path from a multi-scenario perspective: based on rice-leap model[J]. Resources Science, 2021, 43(4): 639-651. (in Chinese) [13] 赵金元, 马振, 唐海亮. BP神经网络和多元线性回归模型对碳排放预测的比较[J]. 科技和产业, 2020, 20(11): 172-176. https://www.cnki.com.cn/Article/CJFDTOTAL-CYYK202011028.htmZHAO J Y, MA Z, TANG H L. Comparison of carbon emission prediction by BP neural network and multiple linear regression model[J]. Science and Technology and Industry, 2020, 20(11): 172-176. (in Chinese) https://www.cnki.com.cn/Article/CJFDTOTAL-CYYK202011028.htm [14] CHEN Z, LIU L, LI C. Prediction and control of carbon emissions of electric vehicles based on BP neural network under carbon neutral background[C]. 2021 International Conference on Neural Networks, Information and Communication Engineering, Qingdao: SPIE, 2021. [15] 栾紫清. 基于灰色关联与预测模型分析陕西省交通运输碳排放[J]. 汽车实用技术, 2019, (3): 121-122.LUAN Z Q. Analysis of carbon emissions of transportation in Shaanxi province based on grey correlation and prediction model[J]. Practical Technologies for Automobiles, 2019, (3): 121-122. (in Chinese) [16] DONG G Z, WEI X Y, XIA Z D, et al. Safety risk assessment of a Pb-zn mine based on fuzzy-grey correlation analysis[J]. Electronics, 2020, 9(1): 130-148. [17] 王永哲, 马立平. 吉林省能源消费碳排放相关影响因素分析及预测: 基于灰色关联分析和GM(1, 1)模型[J]. 生态经济, 2016, 32(11): 65-70. https://www.cnki.com.cn/Article/CJFDTOTAL-STJJ201611013.htmWANG Y Z, MA L P. Analysis and prediction of relevant influencing factors of carbon emission from energy consumption in Jilin Province: Based on grey correlation analysis and GM(1, 1) model[J]. Ecological Economy, 2016, 32 (11): 65-70. (in Chinese) https://www.cnki.com.cn/Article/CJFDTOTAL-STJJ201611013.htm [18] GAO M, SHI G, LI S. Online prediction of ship behavior with automatic identification system sensor data using bidirectional long short-term memory recurrent neural network[J]. Sensors, 2018, 18(12): 4211-4211. [19] CHEN C L, YIN X P. Analysis of decoupling the link between transport and carbon emissions-Case of railway transport in China[C]. International Conference on Electronics, Ningbo: IEEE, 2011. [20] 安实, 王雷, 周超. 基于神经网络及关联性修正的交通异常预测研究[J]. 交通信息与安全, 2019, 217(2): 10-17. doi: 10.3963/j.issn.1674-4861.2019.02.002AN S, WANG L, ZHOU C. Research on traffic anomaly prediction based on neural network and correlation correction[J]. Journal of Transport Information and Safety, 2019, 217(2): 10-17. (in Chinese) doi: 10.3963/j.issn.1674-4861.2019.02.002 [21] 王余宽, 谢新连, 马昊, 等. 基于滑动窗口LSTM网络的船舶航迹预测[J]. 上海海事大学学报, 2022, 43(1): 14-22.WANG Y K, XIE X L, MA H, et al. Ship trajectory prediction based on sliding window LSTM network[J]. Journal of Shanghai Maritime University, 2022, 43(1): 14-22. (in Chinese) -

 点击查看大图
计量
- 文章访问数: 616
- HTML全文浏览量: 187
- PDF下载量: 59
- 被引次数: 0