

A Method for Identifying Traffic Congestion Resulting from Accidents on Freeways
-
摘要: 为量化分析不同交通事故条件下的高速公路路段拥堵情况,研究路段偶发性拥堵规律,本文构建了1个基于行程时间可靠性指标的高速公路路段拥堵判别方法。建立基于美国《公路通行能力手册》中行程时间可靠性分析方法的路段行程时间可靠性模型,并采用西南某高速公路路段实际数据校准模型。利用蒙特卡洛模拟方法生成交通事故场景,将交通事故解构为交通事故发生位置、交通事故严重程度、交通事故持续时间、交通事故发生频率4个特征,并以行程时间指数为路段拥堵量化指标,研究不同交通事故特征水平下的高速公路路段拥堵规律,并判别路段拥堵程度。研究结果表明:美国《公路通行能力手册》的行程时间可靠性分析方法具有可移植性,校准后可应用于国内高速公路路段;交通量接近饱和时,交通事故发生在出口匝道段的拥堵程度高于基本路段与入口匝道段,单车道关闭场景下的交通事故影响远高于路肩关闭场景下的交通事故;交通量接近自由流状态时,拥堵程度对严重程度不敏感;任何交通量水平下,单车道关闭场景下的交通事故持续时间一旦超过15 min,路段拥堵程度极有可能剧增。本文构建的路段拥堵判别方法,可以在精细化探究偶发性交通事故拥堵规律的同时划分路段拥堵等级,为相关部门的事故管理提供理论支撑。Abstract: Based on the reliability of travel time, a method for identifying traffic congestion resulting from accidents is proposed, in order to quantitatively study how random congestion takes place on freeway sections and how congestion evolves under various traffic accidents. A model based on the method for studying the reliability of travel-time outlined in the Highway Capacity Manual is developed, which is calibrated based on observed data from a section of a freeway in Southwest China. A Monte Carlo simulation method is adopted to simulate various traffic accident scenarios. These traffic accidents are featured by four characteristics: location, severity, duration, and frequency. The mechanism that traffic congestion takes place and evolves is investigated and travel time index is used to represent the level of congestion on freeway sections under different traffic accidents. Study results show that ①The method presented in the Highway Capacity Manual is portable. ②When traffic volume is closed to saturation, the impact of traffic accidents taking place at the off-ramp sections is higher than those occur in the basic and on-ramp sections, and their impact is much higher under the single-lane closure scenario than that under the shoulder-closure scenario. ③When the traffic flow is close to free flow, the congestion is not sensitive to the accident severity. ④ Congestion would increase dramatically under the single-lane closure scenario when the accident lasts for more than 15 minutes at any traffic volume level. The proposed method for identifying traffic congestion can contribute to detailed exploration of the congestion patterns resulting from traffic accidents as well as classification of the congestion of freeway sections, which shall provide theoretical support to the accident management of relevant highway and transportation departments.
-

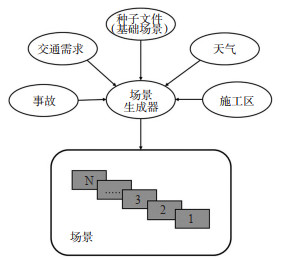
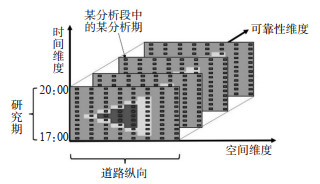
图 1 HCM行程时间可靠性分析方法概念图
Figure 1. Concept diagram of HCM travel time reliability analysis method

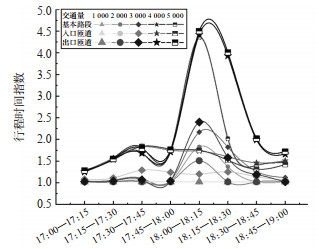
图 7 不同交通事故位置的行程时间指数分布图
注: 交通需求水平为基础场景需求水平、交通事故开始时间分析期5(18:00—18:15)、交通事故持续时间15 min、单车道关闭场景。
Figure 7. Travel time index distribution for different accident locations

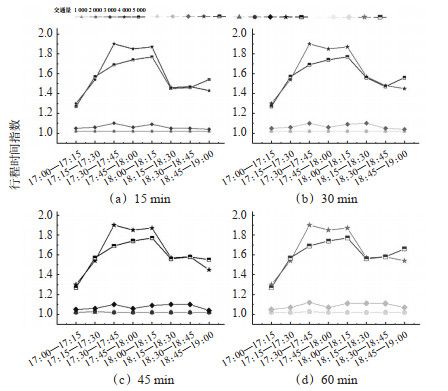
图 8 不同交通事故严重程度的行程时间指数分布图
注: 交通需求为基础场景需求水平、交通事故位置在分析段5(图 5)、交通事故开始时间为分析期5(18:00—18:15)
Figure 8. Travel time index distribution for different severity accident

图 9 不同交通事故持续时间的行程时间指数分布(路肩关闭)
Figure 9. Distribution of different traffic accident duration travel time index for shoulder closure accidents

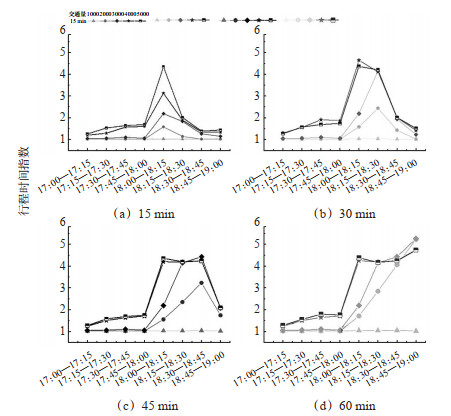
图 10 不同交通事故持续时间的行程时间指数分布(单车道关闭)
注:交通需求为基础场景需求水平、交通事故位置在分析段5(图 5)、交通事故开始时间为分析期5(18:00—18:15)。
Figure 10. Distribution of different traffic accident duration travel time index for single lane closure accidents

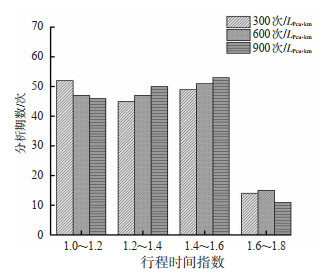
图 11 不同交通事故发生频率的行程时间指数分布图
注:交通需求为基础场景的需求水平、交通事故位置在分析段5(见图 5)、交通事故开始时间为分析期3(17:30—17:45)、交通事故持续时间为15 min、单向2车道公路路肩关闭场景。
Figure 11. Travel time index distribution for different frequency of accident

图 12 基于交通事故的高速公路路段拥堵判别方法
Figure 12. Congestion identification method of highway section based on traffic accidents
表 1 非饱和条件公式参数取值
Table 1. Unsaturated formula parameter value
自由流速度(/km/h) 公式参数 A B C D E 120 68.99 -77.97 34.04 -5.82 0.44 113 71.24 -85.48 35.58 -5.44 0.52 105 92.45 -127.33 56.34 -8.00 0.62 97 121.35 -184.84 83.21 -9.33 0.72 88 156.43 -248.99 99.20 -0.12 0.82  下载: 导出CSV
表 2 数据类型与来源
Table 2. Data type and source
数据 数据来源 车道数 实地调研 路段长度 百度API 路段类型 实地调研 自由流速度 修正基本自由流速度 交通量 ETC数据 平均需求乘数矩阵 实际交通量数据 交通事故数据 实际交通事故数据
下载: 导出CSV
表 3 平均需求乘数矩阵
Table 3. Average demand multiplier matrix
月份 星期 一 二 三 四 五 六 日 一 1.14 1.05 1.09 1.09 1.12 1.11 1.19 二 1.42 1.68 1.69 1.16 1.42 1.52 1.41 三 1.77 1.59 1.65 1.66 1.77 1.67 1.94 四 2.19 1.78 2.02 2.08 2.30 2.47 2.27 五 1.73 2.21 1.72 1.76 2.10 1.82 2.13 六 1.70 1.62 1.74 1.59 1.95 1.80 1.96 七 1.29 1.38 1.31 1.33 1.40 1.28 1.35 八 1.10 1.13 1.12 1.11 1.25 1.27 1.27 九 1.00 0.97 1.01 0.97 1.12 1.05 1.21 十 1.11 1.12 1.15 1.21 1.31 1.20 1.26 十一 1.02 0.98 0.92 0.99 1.23 1.05 1.16 十二 1.12 1.09 1.07 1.06 1.16 1.20 1.24
下载: 导出CSV
表 4 默认交通事故严重程度与交通事故持续时间分布
Table 4. Default accident type distribution and accident duration distribution
参数 路肩关闭 单车道关闭 分布比例/% 75.4 24.6 平均持续时间/min 34.0 34.6 标准差/min 15.1 13.8 最小持续时间/min 8.7 16.0 最大持续时间/min 58.0 58.2
下载: 导出CSV
表 5 交通事故发生频率分布表
Table 5. Accident frequency distribution
月份 交通事故频率 1 0.25 2 0.2 3 0.25 4 0.2 5 0 6 0 7 0.05 8 0.1 9 0.25 10 0.05 11 0.3 12 0.15
下载: 导出CSV
表 6 全局参数初值
Table 6. Initial value of global parameters
参数 取值 主线自由流速/(m/s) 30.56 匝道自由流速/(m/s) 13.33 拥挤密度(pcu/m) 0.118 瓶颈处通行能力下降值/% 7 加速车道长度/m 250 减速车道长度/m 200 货车当量PCE 2 货车率/% 24 拖挂车率/% 8
下载: 导出CSV
表 7 场景参数初值
Table 7. Initial values of scenario parameters
参数 取值 基础场景日期 2018-09-24 研究期 17:00—19:00 可靠性报告期/年 1 可靠性报告开始日期 2018-01-01 可靠性报告结束日期 2018-12-31 场景涉及到的事件类型 交通事故 需求组合副本数/次 4 每周分析天数/d 5(仅工作日) 剔除需求量异常日 节假日及特殊活动
下载: 导出CSV
表 8 通行能力调整因子
Table 8. Capacity adjustment factors
单向车道数 无交通事故 路肩关闭 单车道关闭 2 1.00 0.81 0.70 注: 表中值为可以正常通行车道的通行能力折减。
下载: 导出CSV
-
[1] 李淑庆, 彭囿朗, 肖莉英, 等. 道路交通事故发生机理研究现状与趋势分析[J]. 安全与环境学报, 2014, 14(3): 14-19. https://www.cnki.com.cn/Article/CJFDTOTAL-AQHJ201403005.htmLI S Q, PENG Y L, XIAO L Y, et al. Analysis of mechanism of the road traffic accidents in-situ and the future research trends[J]. Journal of Safety and Environment, 2014, 14(3): 14-19. (in Chinese) https://www.cnki.com.cn/Article/CJFDTOTAL-AQHJ201403005.htm [2] 国家统计局. 2021年交通事故数据[EB/OL]. (2022-1)[2022-1-17]. https://data.stats.gov.cn/search.htm?s=%E4%BA%A4%E9%80%9A%E4%BA%8B%E6%95%85 .NATIONAL BUREAU OF STATISTICS. Traffic accident data for 2021[EB/OL]. (2022-1)[2022-1-17].https://data.stats.gov.cn/search.htm?s=%E4%BA%A4%E9%80%9A%E4%BA%8B%E6%95%85 . (in Chinese)[3] LOMAX T, TURNER S, SHUNK G, et al. Quantifying congestion. Volume 1: final report[R]. Texas: Texas Transportation Institute, 1997. [4] KOUKIS D, ANTONATOS S, ANTONIADES D, et al. A generic anonymization framework for network traffic[J]. IEEE International Conference on Communications, 2006, 19(3): 2302-2309. [5] 庄斌, 杨晓光, 李克平. 道路交通拥挤事件判别准则与检测算法[J]. 中国公路学报, 2006, 19(3): 82-86. doi: 10.19721/j.cnki.1001-7372.2006.03.015ZHUANG B, YANG X G, LI K P. Criteria and detection algorithm of road traffic congestion events[J]. China Journal of Highway and Transport, 2006, 19(3): 82-86. (in Chinese) doi: 10.19721/j.cnki.1001-7372.2006.03.015 [6] LAM T. The effect of variability of travel time on route and time-of-day choice[D]. California: University of California, 2000. [7] RAFFERTY P. Practical benefits analysis of travel time reliability from automated detection[J]. Transportation Research Record, 2009(2115): 119-126. [8] ELIASSON J. The relationship between travel time variability and road congestion[C]. 11th World Conference on Transport Research, Berkeley CA, Unites States: TRB, 2007. [9] YANG M L, LIU Y G, YOU Z S. The reliability of travel time forecasting[J]. IEEE Transactions on Intelligent Transportation Systems, 2010, 11(1): 162-171. doi: 10.1109/TITS.2009.2037136 [10] 黄帅凤. 基于手机数据的高速公路行程时间可靠性评估方法研究[D]. 南京: 东南大学, 2018.HUANG S F. Research on freeway travel time reliability evaluation method based on mobile phone data[D]. Nanjing: Southeast University, 2018. (in Chinese) [11] WOODARD D, NOGIN G, KOCH P, et al. Predicting travel time reliability using mobile phone GPS data[J]. Transportation Research Part C: Emerging Technologies, 2017(75): 30-44. [12] ASAKURA A. Reliability measures of an origin and destination pair in a deteriorated road network with variable flows[C]. 4th EURO Transportation Meeting on Transportation Networks, Newcastle, Australia: Elsevier Science BV, 1998. [13] 薛晓姣, 杨宏志, 任楠. 应急条件下区域路网行程时间可靠性研究[J]. 交通信息与安全, 2019, 37(2): 25-32. doi: 10.3963/j.issn.1674-4861.2019.02.004XUE X J, YANG H Z, REN N. Travel time reliability of regional road network under emergency conditions[J]. Journal of Transport Information and Safety, 2019, 37(2): 25-32. (in Chinese) doi: 10.3963/j.issn.1674-4861.2019.02.004 [14] 冷军强. 冰雪条件下城市路网行程时间可靠性研究[D]. 哈尔滨: 哈尔滨工业大学, 2010.LENG J Q. Travel time reliability of urban road network under ice and snowfall conditions[D]. Harbin: Harbin Institute of Technology, 2010. (in Chinese) [15] 王婧, 何杰, 吴炼. 雨天高速公路网行程时间可靠性评价方法[J]. 交通运输系统工程与信息, 2011, 11(6): 117-123.WANG J, HE J, WU L. Evaluating approach of travel time reliability for highway network under rain environment[J]. Journal of Transportation Systems Engineering and Information Technology, 2011, 11(6): 117-123. (in Chinese) [16] 张琦, 陈红, 刘至真, 等. 降雨量对OD行程时间可靠性影响分析[J]. 交通运输系统工程与信息, 2019, 19(6): 243-249.ZHANG Q, CHEN H, LIU Z Z, et al. Analysis of effects of rainfall on origin-destination-based travel time reliability[J]. Journal of Transportation Systems Engineering and Information Technology, 2019, 19(6): 243-249. (in Chinese) [17] 刘永红, 李进龙, 陈欣, 等. 先进出行信息下交通事故对行程时间可靠性的影响[J]. 交通运输系统工程与信息, 2018, 18(3): 36-41. https://www.cnki.com.cn/Article/CJFDTOTAL-YSXT201803006.htmLIU Y H, LI J L, CHEN X, et al. Impact of incident on travel time reliability in advanced traveler information systems[J]. Journal of Transportation Systems Engineering and Information Technology, 2018, 18(3): 36-41. (in Chinese) https://www.cnki.com.cn/Article/CJFDTOTAL-YSXT201803006.htm [18] 陈玲娟, 刘海旭, 蒲云. 交通事故持续期内行程时间的可靠性研究[J]. 西南交通大学学报, 2013, 48(2): 376-382. https://www.cnki.com.cn/Article/CJFDTOTAL-XNJT201302029.htmCHEN L J, LIU H X, PU Y. Travel time reliability during incident duration time[J]. Journal of Southwest Jiaotong University, 2013, 48(2): 376-382. (in Chinese) https://www.cnki.com.cn/Article/CJFDTOTAL-XNJT201302029.htm [19] CISZEWSKAK E, ROMANOWSKAA, KUSTRAW. Analysing the impact of traffic incidents on express road traffic flow using FREEVAL[C]. 12th International Road Safety Conference GAMBIT 2018, Gdansk, Poland: EDP Sciences, 2018. [20] ASAKURA Y, KASHIWADANI M. Road network reliability caused by daily fluctuation of traffic flow[C]. 19th PTRC Summer Annual Meeting, University of Sussex, United Kingdom: TRB, 1991. [21] BHATTACHARYA M, MAZUMDER P, LOMAX R J. FD-TLM electromagnetic field simulation of high-speed Ⅲ-Ⅴ heterojunction bipolar transistor digital logic gates[C]. 14th International Conference on VLSI Design, Bangalore, India: IEEE, 2001. [22] Transportation Research Board. Highway Capacity Manual[M]. Washington, D.C. : NationalAcademy of Sciences, 2016. [23] FHWA. Travel time reliability: making it there on time, all the time[EB/OL].[2022-4-18]. http://ops.fhwa.dot.gov/publications/tt_reliability/TTR_Report.htm .[24] PU W J. Analytic relationships between travel time reliability measures[J]. Transportation Research Record, 2011(2254): 122-130. [25] LAM T C, SMALL K A. The value of time and reliability: measurement from a value pricing experiment[J]. Transportation Research Part E: Logistics and Transportation Review, 2001, 37(2-3): 231-251. [26] SCHROEDER B J, ROUPHAIL N M, AGHDASHI S. Deterministic framework and methodology for evaluating travel time reliability on freeway facilities[J]. Transportation Research Record, 2013, 2396(1): 61-70. [27] CHEN H, YOU Y S, ZHOU J B, et al. A simplified approach to estimate the urban expressway capacity after traffic accidents using a micro-simulation model[J]. Advances in Mechanical Engineering, 2013(5): 656345. [28] 郑来, 顾鹏, 卢健. 基于T-S模糊故障树和贝叶斯网络的重特大交通事故成因分析[J]. 交通信息与安全, 2021, 39 (4): 43-51. doi: 10.3963/j.jssn.1674-4861.2021.04.006ZHENG L, GU P, LU J. A cause analysis of extraordinarily severe traffic crashesbased on T-S fuzzy fault tree and bayesiannetwork[J]. Journal of Transport Information and Safety, 2021, 39(4): 43-51. (in Chinese) doi: 10.3963/j.jssn.1674-4861.2021.04.006 [29] 胡骥, 闫章存, 卢小钊, 等. 基于有序Logit与Probit模型的交通事故严重性影响因素分析[J]. 安全与环境学报, 2018, 18(3): 836-843.HU J, YAN Z C, LU X Z, et al. Analysis for the influential factors of the accident severity based on the ordinal logit and probit models[J]. Journal of Safety and Environment, 2018, 18(3): 836-843. (in Chinese) [30] 刘伟铭, 管丽萍, 尹湘源. 基于决策树的高速公路事件持续时间预测[J]. 中国公路学报, 2005, 18(1): 99-103. https://www.cnki.com.cn/Article/CJFDTOTAL-ZGGL200501022.htmLIU W M, GUAN L P, YIN X Y. Prediction offreeway incident duration based on the decision tree[J]. China Journal Highway and Transport, 2005, 18(1): 99-103. (in Chinese) https://www.cnki.com.cn/Article/CJFDTOTAL-ZGGL200501022.htm [31] 蓝岚, 路峰, 王军. 城市交通事故现场处理时间及影响因素分析[J]. 安全与环境学报, 2021, 21(3): 1173-1181. https://www.cnki.com.cn/Article/CJFDTOTAL-AQHJ202103037.htmLAN L, LU F, WANG J. Analysis of the on-site processing time and the influential factors of the urban traffic accidents[J]. Journal of Safety and Environment, 2021, 21(3): 1173-1181. (in Chinese) https://www.cnki.com.cn/Article/CJFDTOTAL-AQHJ202103037.htm -


 点击查看大图
计量
- 文章访问数: 1316
- HTML全文浏览量: 685
- PDF下载量: 94
- 被引次数: 0