

A Prediction Model for Operation Speed of Six-axis Articulated Trains in Uphill Sections of Expressways
-
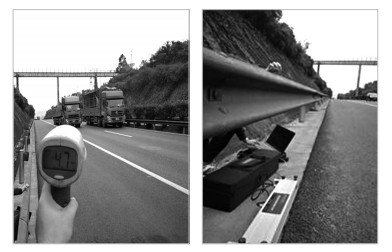
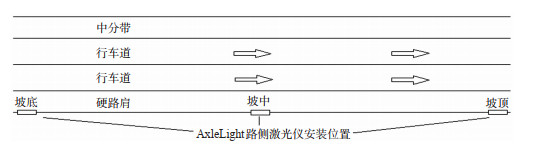
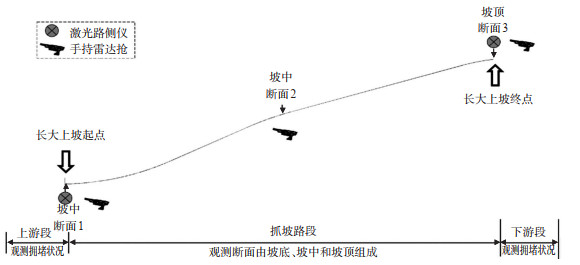
摘要: 为确保车辆在上坡路段的行驶安全,针对高速公路6轴铰接列车在上坡路段运行速度预测误差大、安全运营管理难的问题,提出了面向上坡路段6轴铰接列车的运行速度预测模型。采用雷达测速仪和AxleLight路侧激光仪采集西南某山区高速公路5处连续上坡路段的6轴铰接列车的交通流数据,并对实际运行速度与现有规范预测模型进行对比分析。以纵坡坡度、纵坡长度、车辆比功率、初始运行速度4个参数为变量,构建上坡路段运行速度预测模型。提出了预测模型误差修正方法,并分析了模型的有效性。结果表明:现有规范运行速度模型对6轴铰接列车运行速度的预测平均误差率达到了25.37%,模型误差较为显著;上坡路段6轴铰接列车的运行速度与坡度、坡长呈负相关,与车辆比功率呈正相关;构建的多元线性回归模型拟合优度R2为0.978,且满足相关检验指标;模型预测速度与实际速度差在2~4 km/h之间、相对误差平均值为8.86%,其结果较规范模型降低了16.51%;考虑交通密度因素修正后,模型预测速度与实际速度差在1 km/h以内、相对误差平均值为1.08%,其结果较未经修正的预测模型降低了7.78%,较规范模型降低了24.29%。由此可见,该速度预测模型对长上坡路段6轴铰接列车运行速度预测的准确性提升明显。Abstract: The prediction error of operation speed of 6-axis articulated trains in uphill sections of expressways is large, and its safe operation management is challenging. An Operation Speed Prediction Model (OSPM) is proposed to address this issue. Radars and AxleLight side lasers are used to collect the traffic flow data of six-axis articulated trains at five continuous uphill sections of an expressway from Southwest China. Moreover, the actual operation speed is compared with the results from an existing standard prediction model. Then the OSPM for six-axis articulated trains in uphill sections of expressways is developed by taking the gradient and the length of the uphill, the specific power, and the initial speed of the trains as variables. Lastly, an error correction method is developed, and effectiveness of the proposed method is analyzed. The main results are shown as follows: the average rate of prediction error of the standard model reaches 25.37%, and the prediction error is relatively significant. The operation speed is negatively correlated to the gradient and the length of uphill, while it is positively correlated to specific power of the train. The goodness of fit of multiple linear regression model R2 is 0.978, meeting the test requirement. The difference between the predicted speed and the actual speed is in the range of 2-4 km/h, and the average relative error is 8.86%, which is 16.51% less than the standard model. Considering the influences of traffic density, the revised model can reduce the error within 1 km/h; the average relative error is 1.08%, which is 7.78% less than the original model and 24.29% less than the standard model. These results reveal that the proposed OSPM can considerably improve the accuracy of the operation speed prediction.
-
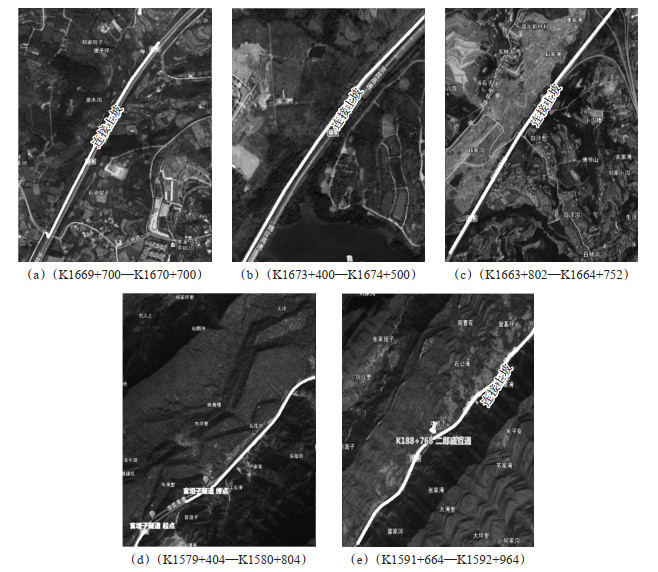
表 1 调研路段数据表
Table 1. Research section data sheet
起始桩号 终点桩号 平均坡度/% 坡长/km 备注 K1669+700 K1670+700 4.944 1 单坡 K1673+400 K1674+500 4.94 1.1 单坡 K1663+802 K1664+752 4.76 0.95 单坡 K1579+404 K1580+804 4.25 1.4 单坡 K1591+664 K1592+964 4.6 1.3 单坡  下载: 导出CSV
表 2 K1669+700—K1670+700处坡底速度分布检验
Table 2. Distribution of velocity distribution at K1669+700—K1670+700
样本M分组 实际频数mi 分布概率Ø1 分布概率Ø2 理论概率pi = Ø1-Ø2 理论频数npi Χ2 [50.55] 7 0.031 0 0.009 0 0.022 0 5.477 3 0.423 3 [55.60] 8 0.085 8 0.031 0 0.054 8 13.653 0 2.340 6 [60.65] 35 0.192 8 0.085 8 0.107 0 26.649 8 2.616 4 [65.70] 47 0.356 5 0.192 8 0.163 6 40.738 3 0.962 5 [70.75] 56 0.552 3 0.356 5 0.195 9 48.772 8 1.070 9 [75.80] 41 0.736 0 0.552 3 0.183 7 45.732 9 0.489 8 [80.85] 26 0.870 9 0.736 0 0.134 9 33.585 5 1.713 2 [85.90] 15 0.948 5 0.870 9 0.077 6 19.316 6 0.964 6 [90.95] 8 0.983 4 0.948 5 0.034 9 8.700 3 0.056 4 [95.100] 7 0.995 7 0.983 4 0.012 3 3.068 5 5.037 4 [100.105] 1 0.999 1 0.995 7 0.003 4 0.847 3 0.027 5 [105.110] 1 0.999 9 0.999 1 0.000 7 0.183 2 3.643 0 总计 19.345 6
下载: 导出CSV
表 3 χ2检验结果汇总表
Table 3. Summary of χ2 test results
起止桩号 观测位置 χ2检验结果 K1669+700—K1670+700 坡底 χ2 = 19.345 6 < χ0.052(14-2-1) = 21.026 坡中 χ2 = 20.387 4 < χ0.052(15-2-1) = 22.362 坡顶 χ2 = 18.241 1 < χ0.052(17-2-1) = 24.996 K1673+400—K1674+500 坡底 χ2 = 18.243 2 < χ0.052(16-2-1) = 23.685 坡中 χ2 = 18.963 4 < χ0.052(14-2-1) = 21.026 坡顶 χ2 = 17.035 8 < χ0.052(15-2-1) = 22.362 K1663+802—K1664+752 坡底 χ2 = 20.065 4 < χ0.052(14-2-1) = 21.026 坡中 χ2 = 19.906 1 < χ0.052(15-2-1) = 22.362 坡顶 χ2 = 17.565 4 < χ0.052(13-2-1) = 19.675 K1579+404—K1580+804 坡底 χ2 = 19.685 2 < χ0.052(14-2-1) = 21.026 坡中 χ2 = 20.036 0 < χ0.052(15-2-1) = 22.362 坡顶 χ2 = 19.946 5 < χ0.052(14-2-1) = 21.026 K1591+664—K1592+964 坡底 χ2 = 18.792 4 < χ0.052(13-2-1) = 19.675 坡中 χ2 = 19.565 8 < χ0.052(16-2-1) = 23.685 坡顶 χ2 = 20.364 8 < χ0.052(14-2-1) = 21.026
下载: 导出CSV
表 4 纵坡运行速度折算模型
Table 4. Longitudinal slope running speed conversion model
上坡坡度 运行速度调整值 小型车 大型车 3%坡度≤4% 每100 m降低5 km/h 每100 m降低10 km/h 坡度 > 4% 每100 m降低8 km/h 每100 m降低20 km/h
下载: 导出CSV
表 5 运行速度误差对比
Table 5. Comparison of operating speed errors
路段 运行速度(/km/h) 小车 中型车 大型车 特大型车 实测值 预测值 误差率/% 实测值 预测值 误差率/% 实测值 预测值 误差率/% 实测值 预测值 误差率/% 1 91.7 85.49 6.77 69 60.32 12.58 53.2 74.02 39.14 50.7 59.92 18.19 2 90.8 84 7.49 68.3 65.78 3.69 51.3 60.28 17.50 41 61.88 50.93 3 98 102 4.08 64.7 59 8.81 58.5 66 12.82 66.7 61 8.55 4 104 110 5.77 73.3 80 9.14 69.1 80 15.77 64.6 80 23.84 平均误差率/% 6.03 8.55 21.31 25.37
下载: 导出CSV
表 6 共线性诊断分析
Table 6. Collinear diagnostic analysis
模型 维数 特征值 条件索引 方差比例 (常量) V1 L P i 1 1 4.851 1 0 0 0 0 0 2 0.136 5.972 0 0.03 0.01 0 0 3 0.008 25.314 0.01 0.18 0.01 0.86 0 4 0.005 31.053 0.01 0.76 0.04 0.02 0.21 5 0.001 94.957 0.98 0.04 0.93 0.12 0.79
下载: 导出CSV
表 7 回归系数分析
Table 7. Analysis of regression coefficients
模型参数 非标准化系数 标准系数 T检验 Sig. B的95% 置信区间 相关性 共线性统计量 B 标准误差 下限 上限 零阶相关 偏相关 部分相关 容差 VIF C 75.814 4.293 17.659 0 67.318 84.31 V1 -0.029 0.019 -0.057 -1.567 0.12 -0.066 0.008 -0.676 -0.138 -0.021 0.131 7.627 L -11.411 1.897 -0.296 -6.015 0 -15.166 -7.657 0.788 -0.472 -0.079 0.071 14.047 P 8.297 0.195 0.868 42.463 0 7.91 8.684 -0.132 0.967 0.558 0.414 2.416 i -18.9 0.603 -1.628 -31.322 0 -20.094 -17.706 -0.791 -0.941 -0.412 0.064 15.629
下载: 导出CSV
表 8 新建模型与实测数据对比分析
Table 8. Comparative analysis of new model and measured data
路段特点 样本值 坡底速度/(km/h) 坡顶速度实测值/(km/h) 预测值/(km/h) 相对误差/% 相对误差平均值/% 相对误差总平均值/% i=4.25, L=1.4 64 78 46 50.02 8.74 8.50 8.86 80 46 49.89 8.45 ⋮ ⋮ ⋮ ⋮ 78 48 51.99 8.31 i=4.6, L=1.3 78 79 42 46.21 10.02 9.23 76 43 47.22 9.81 ⋮ ⋮ ⋮ ⋮ 81 48 51.76 7.83
下载: 导出CSV
表 9 各路段平均车速值
Table 9. Average speed of each section
路段特点 时间平均车速/(km/h) 时间平均车速标准差 区间平均车速/(km/h) i=4.25, L=1.4 63.77 6.76 63.05 i=4.6, L=1.3 61.86 5.98 61.28
下载: 导出CSV
表 10 通行能力计算表
Table 10. Capacity calculation table
交通流参数 计算结果 ff 1.0 fp 1.0 PT/% 28.94 ET 5.0 fHV 0.4635 C1(/ pcu/h) 2000 C2(/ pcu/h) 927
下载: 导出CSV
表 11 各路段交通密度
Table 11. Traffic density of each section
路段特点 实际交通量/(pcu/h) 区间平均车速/(km/h) 交通密度K/veh/km) 最佳密度Km /veh/km) i=4.25, L=1.4 64 63.05 1.02 14.70 i=4.6, L=1.3 78 61.28 1.27 15.13
下载: 导出CSV
表 12 修正模型相对误差
Table 12. Correcting the relative error of the model
路段特点 样本值 坡底速度/(km/h) 坡顶速度实测值(/ km/h) 预测值/(km/h) 修正后模型预测值(/ km/h) 修正后相对误差/% 相对误差平均值/% 相对误差总平均值/% i=4.25, L=1.4 64 78 46 50.02 46.67 1.45 1.19 1.08 80 46 49.89 46.55 1.19 ⋮ ⋮ ⋮ ⋮ ⋮ 78 48 51.99 48.50 1.05 i=4.6, L=1.3 78 79 42 46.21 42.49 1.17 0.98 76 43 47.22 43.12 0.97 ⋮ ⋮ ⋮ ⋮ ⋮ 81 48 51.76 47.59 0.85
下载: 导出CSV
-
[1] DONNELL E, NI Y, ADOLINI M, et al. Speed prediction models for trucks on two-lane rural highways[J]. Transportation Research Record. 2001, 1751(1): 44-55. doi: 10.3141/1751-06 [2] PARK Y J, SACCOMANNO F F. Evaluating speed consistency between successive elements of a two-lane rural highway[J]. Transportation Research Part A: Policy and Practice. 2006, 40(1): 375-385. [3] DAVID L C, BRAYAN G H, ANA M P Z, et al. Speed prediction models for trucks on horizontal curves of two-lane rural roads[J]. Transportation Research Record. 2018, 2672(17): 72-82. doi: 10.1177/0361198118776111 [4] MAJI A, SIL G, TYAGI A. 85th and 98th percentile speed prediction models of car, light, and heavy commercial vehicles for four-lane divided rural highways[J]. Journal of Transportation Engineering, Part A: Systems. 2018, 144(5): 1-8. [5] 林宣财, 张旭丰, 王佐, 等. 大型货车功重比对高速公路连续下坡路段交通安全性的影响[J]. 公路交通科技, 2021, 38(9): 98-104. doi: 10.3969/j.issn.1002-0268.2021.09.013LIN X C, ZAHNG X F, WANG Z, et al. Influence of power-weight ratio of large truck on traffic safety of continuous downhill section of expressway[J]. Journal of Highway and Transportation Research and Development, 2021, 38(9): 98-104. (inChinese doi: 10.3969/j.issn.1002-0268.2021.09.013 [6] 束海波, 邵毅明. 高速公路上坡路段半挂汽车列车行驶速度特性试验研究[J]. 重庆交通大学学报(自然科学版), 2019, 38(9): 128-132. doi: 10.3969/j.issn.1674-0696.2019.09.21SHU H B, SHAO Y M. Experimental study on operating speed characteristics of tractor-semitrailer on expressway uphill section[J]. Journal of Chongqing Jiaotong University(Natural Science), 2019, 38(9): 128-132. (inChinese doi: 10.3969/j.issn.1674-0696.2019.09.21 [7] MCFADDEN J, YANG W T, DURRANS S. Application of artificial neural networks to predict speeds on two-lanerural highways[J]. Transportation Research Record. 2001, 1751(1): 9-17. doi: 10.3141/1751-02 [8] MORRIS C M, DONNELL E T. Passenger car and truck operating speed models on multilane highways with combinations of horizontal curves and steep grades[J]. Journal of Transportation Engineering, 2014, 140(11), 401-405. [9] SVENSON G, FJELD D. The impact of road geometry, surface roughness and truck weight on operating speed of logging trucks[J]. Scandinavian Journal of Forest Research, 2017 (32): 515-527. [10] 李维东, 乔建刚, 郭蕊. 基于TruckSim的大型货物运输车辆安全运行纵坡最大长度研究[J]. 中国安全生产科学技术, 2020, 16(8): 179-185. https://www.cnki.com.cn/Article/CJFDTOTAL-LDBK202008036.htmLI W D, QIAO J G, GUO R. Research on maximum length of highway longitudinal slope for safe operation of large cargo transportation vehicles based on truckSim[J]. Journal of Safety Science and Technology, 2020, 16(8): 179-185. (in Chinese) https://www.cnki.com.cn/Article/CJFDTOTAL-LDBK202008036.htm [11] 吴艳霞, 刘剑, 黄帅等. 雨天高速公路纵坡对驾驶员心率及行车速度影响[J]. 交通信息与安全, 2021, 39(4): 35-42. doi: 10.3963/j.jssn.1674-4861.2021.04.005WUY X, LIU J, HUANG S, et al. Influences of longitudinal slopes of highways on drivers' heart rate and driving speeds on rainy days[J]. Journal of Transport Information and Safety, 2021, 39(4): 35-42. (in Chinese) doi: 10.3963/j.jssn.1674-4861.2021.04.005 [12] 徐婷, 李敏, 杨新新, 等. 重载车爬坡下的公路临界坡长确定[J]. 交通信息与安全, 2016, 34(3): 88-95. doi: 10.3963/j.issn1674-4861.2016.03.012XU T, Ll M, YANG X X, et al. The critical length of slopes on highways for heavy-duty vehicles[J]. Journal of Transport Information and Safety, 2016, 34(3): 88-95. (in Chinese) doi: 10.3963/j.issn1674-4861.2016.03.012 [13] 董忠红, 倪凤英, 柳帅蒙, 等. 长大纵坡路段重型车辆爬坡速度[J]. 长安大学学报(自然科学版), 2014, 34(3): 23-27. doi: 10.3969/j.issn.1671-8879.2014.03.004DONG Z H, Nl F Y, LIU S M, et al. Heavy truck climbing speed on long and steep longitudinal slope section[J]. Journal of Chang'an University(Natural Science Edition). 2014, 34(3): 23-27. (in Chinese) doi: 10.3969/j.issn.1671-8879.2014.03.004 [14] 刘学. 长大纵坡路段重型车辆荷载特性研究[D]. 西安: 长安大学, 2013.LIU X. Study on the loading performance of long and steep longitudinal slope sections under heavy truck[D]. Xi'an: Chang'an University, 2013. (in Chinese) [15] 方靖, 荣建, 祝站东. 自由流状态的判别标准研究[J]. 中国公路学报, 2010, 23(增刊1): 65-68. https://www.cnki.com.cn/Article/CJFDTOTAL-ZGGL2010S1013.htmFANG J, RONG J, ZHU Z D. Research on discrimination criterion of free flow state[J]. China Journal ofHighway and Transport, 2010, 23(S1): 65-68. (in Chinese) https://www.cnki.com.cn/Article/CJFDTOTAL-ZGGL2010S1013.htm [16] 中华人民共和国交通运输部. 公路项目安全性评价规范: JTG/T B05-2015[S]. 北京: 人民交通出版社, 2015.Ministry of Transport, People's Republic of China. Highway project safety evaluation specification: JTG/T B05-2015[S]. Beijing: China Communications Press, 2015. (inChinese [17] 长安大学. 2016中国高速公路运输量统计调查分析报告[M]. 北京: 人民交通出版社, 2017.Chang'an University. Statistical investigation and analysis report of China's highway transportation volume in 2016[M]. Beijing: China Communications Press, 2017. (inChinese [18] 郭腾峰, 张志伟, 刘冰, 等. 适应6轴铰接列车动力性的高速公路最大纵坡坡度和坡长[J]. 交通运输工程学报, 2018, 18(3): 34-43. doi: 10.3969/j.issn.1671-1637.2018.03.005GUO T F, ZHANG Z W, LIU B, et al. Maximum grade and length of longitudinal slope adapted to dynamic performance of six-axis articulate[J]. Journal of Traffic and Transportation Engineering, 2018, 18(3): 34-43. (in Chinese) doi: 10.3969/j.issn.1671-1637.2018.03.005 [19] 白辂韬. 基于线形条件的高速公路运行速度预测及控制研究[D]. 天津: 天津大学, 2013.BAI Y T. Research on expressway speed prediction and control based on linear conditions[D]. Tianjin: Tianjin University, 2013. (in Chinese) [20] 李力, 姜锐, 贾斌, 等. 现代交通流理论与应用: 高速公路交通流. 卷Ⅰ[M]. 北京: 清华大学出版社, 2011.LI L, JIANG R, JIA B, et al. Modern traffic flow theory and application: Highway traffic flow. volume I[M]. Beijing: Tsinghua University Press, 2011. (in Chinese) [21] 汪双杰, 周荣贵, 孙小端. 公路运行速度设计理论与方法[M]. 北京: 人民交通出版社, 2010.WANG S J, ZHOU R G, SUN X D. Theory and method ofhighway operation speed design[M]. Beijing: People's Communications Press, 2010. (in Chinese) [22] 刘灿齐, 陈军. 基于Edie模型的路阻函数关系推导及其拟合分析研究[J]. 交通标准化, 2012(4): 33-36. doi: 10.3869/j.issn.1002-4786.2012.04.004LIU C Q, CHEN J. A deduction of impedance function based on edie model and ilts fitting analysis[J]. Communications Standardization, 2012(4): 33-36. (in Chinese) doi: 10.3869/j.issn.1002-4786.2012.04.004 [23] 李希瑞. 基于收费数据的高速公路交通流特性分析及通行能力研究[D]. 兰州: 兰州交通大学, 2020.LI X R. Analysis of expressway traffic flow characteristics and capacity research based on toll data[D]. Lanzhou: Lanzhou Jiaotong University, 2020. (in Chinese) -


 点击查看大图
计量
- 文章访问数: 1087
- HTML全文浏览量: 454
- PDF下载量: 28
- 被引次数: 0