

A Method for Quantitatively Analyzing Risks Associated with the Operation of Urban Buses Considering Chained Conflicts
-
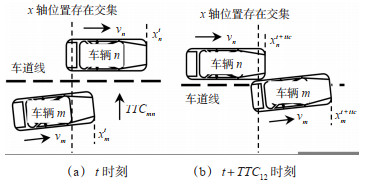
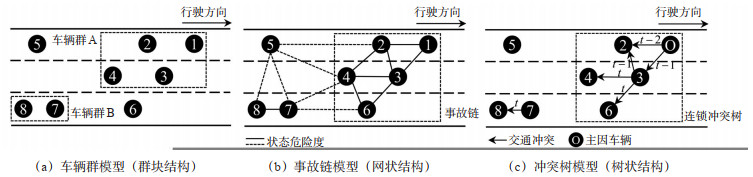
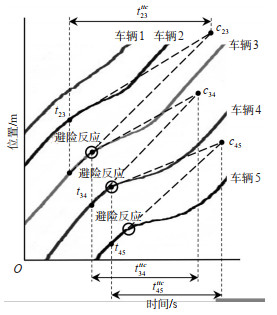
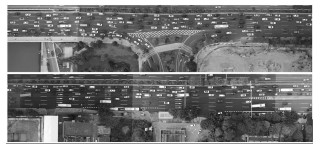
摘要: 为了量化城市公交车给区域混合交通带来的安全风险,通过提取交通冲突数据并识别连锁冲突,研究了公交车行车风险的量化分析方法。在数据采集上,采用了航拍图像并基于YOLOv4网络学习航拍目标的外观特征,检测并跟踪航拍车辆,从而提取带精细属性的车辆轨迹数据。在冲突识别上,将不同车道上可能发生横向碰撞的车辆对之间的相对位置作为约束条件,在跟驰模型的基础上补充了匹配相邻车道上车辆对的动态关系,从而将经典碰撞时间(TTC)模型扩展至可同时识别侧向冲突的二维TTC模型;基于车辆刺激-反应理论标定每个冲突车辆对区域交通造成连续干扰的时空范围,根据干扰范围的动态变化建立冲突间的作用关系并形成时序性的冲突树模型,从而识别连锁冲突并追溯连续风险形成的因果过程。在风险研究上,从3个方面量化不同状态下城市公交车的行车风险:①基于二维TTC模型解析冲突频率;②在此基础上结合累积频率法解析冲突严重性;③通过连锁冲突比例及冲突树长度解析冲突聚集的概率和范围大小。采集广州大桥路段航拍视频进行实验研究,结果表明:城市公交车在拥堵常发路段不仅冲突风险高,且带有较高的冲突严重性和区域聚集性;拥堵流中公交车的冲突频率超过9次(/ veh·min);公交车的严重冲突率为33.39%,远远高于小汽车的16.61%;公交车的区域连锁冲突发生率为30.75%,达到了小汽车(14.67%)的2倍。Abstract: A quantitative method for analyzing risks associated with the operation of buses in mixed traffic environment is studied by extracting data about traffic conflict and identifying a set of chain-conflicts. Regarding data collection, aerial video data are adopted based on which features of objects are extracted using YOLOv4 network. In this way, the trajectories with accurate attributes for buses and other related vehicles can be obtained. Regarding the identification of vehicle conflicts, the relative locations between pairs of vehicles which are likely to collide laterally in different lanes are set up as constraints. Based on the classic car-following model, the dynamic relationship of vehicle pairs in adjacent lanes is studied and added. With this, the classic time-to-collision(TTC)model is extended to a two-dimensional TTC model, which can identify lateral conflicts as well. Next, according to the Stimulus-Re-sponse Theory, the temporal and spatial scope caused by each conflicting vehicle who continuously disturb regional traffic is calibrated to study interrelationships between conflicted vehicles, and a time-series conflict tree model is established. With this, chained conflicts can be identified and the causal relationship between continuous risks can be traced using the conflict tree model. The risks of urban buses under different traffic settings are quantified from the following three aspects: ①the frequency of the conflicts is analyzed based on the two-dimensional TTC model; ②on this basis, the severity of conflicts is analyzed combined with cumulative frequency method; ③the probability and scope of conflicts are analyzed through ratio of chain conflicts and the length of conflict tree. Aerial video data of Guangzhou Bridge Road are collected for a case study. The results show that urban buses in frequently congested sections have high conflict risks, which reveal have high rate of severity and regional aggregation. The conflict frequency of buses in congested traffic flow exceeds 9 times per vehicle per minute. The average rate of serious conflicts of buses is 33.39%, which is much higher than the corresponding rate of regular passenger vehicles(i.e., 16.61%). The rate of regional chain-conflicts caused by buses is 30.75%, which is twice than that of cars(i.e., 14.67%)
-

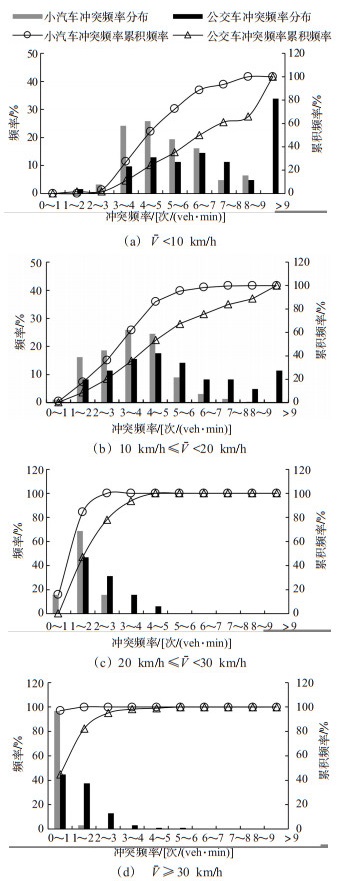
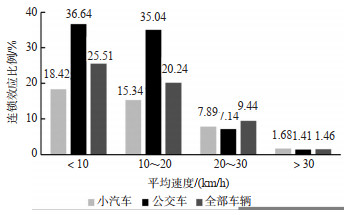
图 8 2类车辆的冲突频率累积频率图
Figure 8. Cumulative frequency diagrams of conflict frequency of the 2 types vehicle

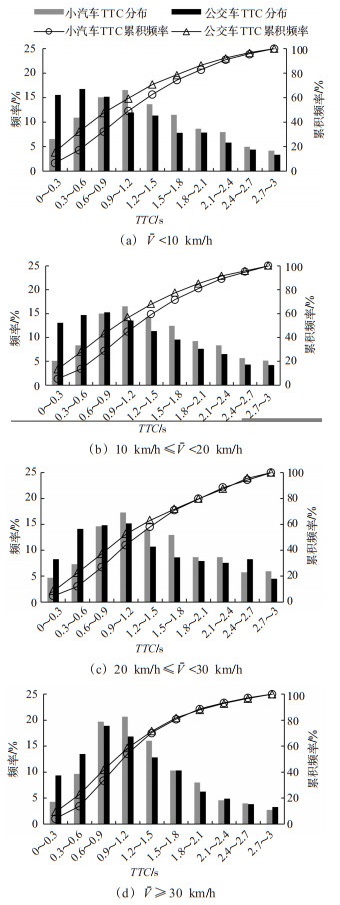
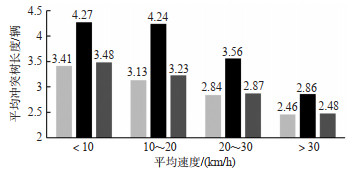
图 9 2类车辆的冲突TTC累积频率图
Figure 9. Cumulative frequency diagrams of conflict TTC of the 2 types vehicle
表 1 车辆检测测试结果
Table 1. Test result of vehicle detection
类别 真值/个 正检/个 误检/个 AP /% mAP /% car 32 284 32 147 445 99.25 90.82 bus 1 590 1 345 86 82.39  下载: 导出CSV
表 2 车辆轨迹数据样例
Table 2. Examples of vehicle trajectory data
时间/s 车辆ID x坐标/m y坐标/m 车长/m 车宽/m 车型 x轴速度/(m/s) y轴速度/(m/s) 车道 跟驰车辆ID 1.5 2 52.77 54.03 12.96 3.13 bus 8.17 -0.33 5 66 1.6 2 53.64 54.07 12.96 3.22 bus 10.11 0 5 75 1.7 2 54.59 54.11 12.62 3.13 bus 11.09 0.65 5 75 1.5 7 79.56 50.07 4.44 2.07 car 6.20 0.33 4 48 1.6 7 80.04 50.11 4.52 2.08 car 6.20 0.65 4 48 1.7 7 80.82 50.11 4.60 2.08 car 5.55 0.65 4 48
下载: 导出CSV
表 3 冲突数据属性含义
Table 3. Attributes meaning of conflict data
属性 含义 属性 含义 冲突ID 每个冲突的唯一标识 冲突前车ID 冲突中位置靠前的车辆ID TTC 冲突过程的最小TTC 冲突后车ID 冲突中位置靠后的车辆ID 冲突时间 最小TTC出现冲突时间的时间 冲突前车类型 car或bus 冲突类型 跟驰冲突或横冲突类型向冲突 冲突后车类型 car或bus
下载: 导出CSV
表 4 不同严重性等级的冲突统计结果
Table 4. Conflict statistics of different severity levels
严重性等级 小汽车 公交车 冲突次数 比例/% 冲突次数 比例/% 严重冲突 24 597 16.61 2 993 33.39 中度冲突 61 551 41.56 3 255 36.32 轻微冲突 61 951 41.83 2 715 30.29
下载: 导出CSV
表 5 冲突严重性分析结果
Table 5. Analysis result of conflict severity
平均速度/(km/h) 冲突等级 小汽车 公交车 折算公交车冲突比例/% 冲突数/次 比率/% 冲突频率/[次/(辆.min)] 冲突数/次 比率/% 冲突频率/[次/(辆.min)] < 10 严重 5 660 21.89 0.96 646 40.71 2.63 10.24 中度 10 406 40.24 1.76 514 32.39 2.09 4.71 轻微 9 795 37.88 1.66 427 26.91 1.74 4.18 共计 25 861 100.00 4.38 1 587 100.00 6.45 5.78 > 10~20 严重 18 440 17.08 0.56 2 140 34.89 1.70 11.29 中度 43 507 40.29 1.31 2 107 34.35 1.67 5.04 轻微 46 043 42.64 1.39 1 887 30.76 1.50 4.30 共计 107 990 100.00 3.26 6 137 100.00 4.88 5.86 > 20~30 严重 703 13.92 0.20 69 25.84 0.51 9.79 中度 2 125 42.07 0.59 113 42.32 0.83 5.53 轻微 2 223 44.01 0.62 85 31.84 0.63 4.03 共计 5 051 100.00 1.41 267 100.00 1.96 5.50 > 30 严重 1 082 11.37 0.05 236 24.01 0.25 17.25 中度 5 273 55.42 0.25 471 47.91 0.51 7.88 轻微 3 160 33.21 0.15 276 28.08 0.30 7.72 共计 9 515 100.00 0.45 983 100.00 1.06 9.00
下载: 导出CSV
表 6 不同方法量化聚集性交通风险的结果对比
Table 6. Comparison of the results from different methods to quantify gathered traffic risks
方法 结果参数 时刻1 时刻2 车辆群模型 聚集风险数 11 10 群内车辆数 {12, 2, 2, 2, 3, 7, 2, 2, 3, 6, 2} {19, 2, 6, 2, 2, 6, 2, 2, 2, 2} 行车风险度 {0.167, 0, 0.5, 0, 0, 0.286, 0, 0, 0, 0.333, 0} {0.316, 0, 0.167, 0, 0, 0.167, 0, 0, 0, 0.5} 事故链模型 聚集风险数 3 2 链内车辆数 {4, 5, 3} {6, 3} 链内危险链数 {2, 3, 2} {3, 2} 冲突树模型 聚集风险数 3 3 树内车辆数 {4, 7, 3} {3, 9, 5} 树内冲突数 {3, 7, 2} P, 11, 6} 连锁冲突时刻/s {[0.4, 0.7, 1.6], [1.9, 3.2, 3.2, 3.2, 4.8, 4.9, 6.2], [0.2, 2.5]} {[10.2, 11.3], [10, 10.9, 11.9, 11.9, 11.9, 13.2, 13.9, 14.1, 14.6, 15.2, 15.8], [11.8, 13, 14.2, 14.9, 15.6, 17.1]} 持续时长/s {1.2, 4.3, 2.3} {1.1, 4.8, 5.3} 主因车辆 {car, bus, bus} {car, car, car}
下载: 导出CSV
表 7 连锁冲突识别结果
Table 7. Results of chained conflict recognition
主因车辆 冲突树数量/个 直接冲突次数/次 连锁冲突数量/次 平均冲突树长度/次 连锁效应比例/% 小汽车 9 159 12 792 16 304 3.18 14.67 公交车 906 1 936 1 896 4.23 30.75
下载: 导出CSV
-
[1] NGODUY D. Effect of the car-following combinations on the instability of heterogeneous traffic flow[J]. Transportmetrica B: Transport Dynamics, 2015, 3(1): 44-58. doi: 10.1080/21680566.2014.960503 [2] 梁国华, 程国柱, 王春艳, 等. 高速公路大型车混入率与交通流稳定性关系[J]. 长安大学学报, 2014, 34(4): 1-8. https://www.cnki.com.cn/Article/CJFDTOTAL-XAGL201404020.htmLIANG G H, CHENG G Z, WANG C Y, et al. Relationship between mixing rate of freeway large vehicles and traffic flow stability[J]. Journal of Chang'an University, 2014, 34 (4): 1-8. (in Chinese) https://www.cnki.com.cn/Article/CJFDTOTAL-XAGL201404020.htm [3] 赵笑月, 汪攀, 朱顺应, 等. 基于视频识别的互通合流区交通冲突空间分布[J]. 公路交通科技, 2021, 38(5): 90-99. doi: 10.3969/j.issn.1002-0268.2021.05.011ZHAO X Y, WANG P, ZHU S Y, et al. Spatial distribution of traffic conflicts in interchange merging area based on video recognition[J]. Journal of Highway and Transportation Research and Development, 2021, 38(5): 90-99. (in Chinese) doi: 10.3969/j.issn.1002-0268.2021.05.011 [4] 陈峻, 王涛, 李春燕, 等. 城市公交车与社会车辆混合流速度模型及交通运行状态分析[J]. 中国公路学报, 2012, 25 (1): 128-140. doi: 10.3969/j.issn.1001-7372.2012.01.019CHEN J, WANG T, LI C Y, et al. Speed models of mixed traffic flow on bus-car and vehicle and analysis of traffic running state[J]. China Journal of Highway Transportation, 2012, 25 (1): 128-140. (in Chinese) doi: 10.3969/j.issn.1001-7372.2012.01.019 [5] 盖靖元. 基于车速离散度的路段交通安全评估方法研究[D]. 南京: 东南大学, 2016.GAI J Y. A study on the assessment of road traffic safety based on speed dispersion[D]. Nanjing: Southeast University, 2016. (in Chinese) [6] GOH K C K. Exploring bus lane impacts using traffic micro-simulation[C]. Australasian Transport Research Forum, Brisbane, Australia: ATRF, 2013. [7] GOH K C K, CURRIE G, SARVI M, et al. Experimental microsimulation modeling of road safety impacts of bus priority[J]. Transportation Research Record, 2014(1): 9-18. [8] QI W W, RUAN L J, ZHI Y, et al. Risk area identification model of bus bay stops based on distribution of conflicts[J]. Discrete Dynamics in Nature and Society, 2021(25): 1-11. [9] BANSAL P, AGRAWAL R, TIWARI G. Impacts of bus-stops on the speed of motorized vehicles under heterogeneous traffic conditions: A study of Delhi, India[J]. International Journal of Transportation Science and Technology, 2014, 3(2): 167-178. doi: 10.1260/2046-0430.3.2.167 [10] DIAH J M, HAMIDUN N Q A. The methodology review of traffic safety monitoring by using video recording for express bus in Malaysia[C]. 14th International Colloquium on Signal Processing and its Applications, Penang, Malaysia: IEEE, 2018. [11] 朱顺应, 蒋若曦, 王红, 等. 机动车交通冲突技术研究综述[J]. 中国公路学报, 2020, 33(2): 15-33. https://www.cnki.com.cn/Article/CJFDTOTAL-ZGGL202002002.htmZHU S Y, JIANG R X, WANG H, et al. Review of research on traffic conflict technique[J]. China Journal of Highway Transportation, 2020, 33(2): 15-33. (in Chinese) https://www.cnki.com.cn/Article/CJFDTOTAL-ZGGL202002002.htm [12] 谢济铭, 秦雅琴, 彭博, 等. 多车道交织区车辆跟驰行为风险判别与冲突预测[J]. 交通运输系统工程与信息, 2021, 21 (3): 131-139. https://www.cnki.com.cn/Article/CJFDTOTAL-YSXT202103016.htmXIE J M, QIN Y Q, PENG B, et al. Risk discrimination and conflict prediction of vehicle-following behavior in multi-lane weaving sections[J]. Journal of Transportation Systems Engineering and Information Technology, 2021, 21 (3): 131-139. (in Chinese) https://www.cnki.com.cn/Article/CJFDTOTAL-YSXT202103016.htm [13] QI W W, WANG W, SHEN B, et al. A modified post encroachment time model of urban road merging area based on lane change characteristics[J]. IEEE Access, 2020 (8) 72835-72846. [14] 龙科军, 张燕, 邹志云, 等. 基于车辆轨迹的信号交叉口机非冲突判别[J]. 交通运输系统工程与信息, 2021, 21(1): 69-74. https://www.cnki.com.cn/Article/CJFDTOTAL-YSXT202101012.htmLONG K J, ZHANG Y, ZOU Z Y, et al. Vehicle and non-motorized vehicle traffic conflict recognition at signalized intersection based on vehicle trajectory[J]. Journal of Transportation Systems Engineering and Information Technology, 2021, 21(1): 69-74. (in Chinese) https://www.cnki.com.cn/Article/CJFDTOTAL-YSXT202101012.htm [15] XIONG X X, CHEN L, LIANG J. A new framework of vehicle collision prediction by combining SVM and HMM[J]. IEEE Transactions on Intelligent Transportation Systems, 2018, 19(3): 699-710. doi: 10.1109/TITS.2017.2699191 [16] 容颖, 温惠英, 赵胜. 高速公路单向双车道车辆群行车风险度量研究[J]. 重庆交通大学学报, 2019, 38(9): 95-100+121. https://www.cnki.com.cn/Article/CJFDTOTAL-CQJT201909016.htmRONG Y, WEN H Y, ZHAO S. Study on driving risk measurement for two-lane freeway vehicle group[J]. Journal of Chongqing Jiaotong University, 2019, 38(9): 95-100+121. (in Chinese) https://www.cnki.com.cn/Article/CJFDTOTAL-CQJT201909016.htm [17] 梁军, 张婉婉, 何美玲, 等. 车联网环境下道路交通事故链阻断效率评价方法研究[J]. 中国公路学报, 2018, 31(4): 211-224. https://www.cnki.com.cn/Article/CJFDTOTAL-ZGGL201804026.htmLIANG J, ZHANG W W, HE M L, et al. A blocking efficiency evaluation method for chains of road traffic incident in IOV environment[J]. China Journal of Highway Transportation, 2018, 31(4): 211-224. (in Chinese) https://www.cnki.com.cn/Article/CJFDTOTAL-ZGGL201804026.htm [18] 杨澜, 马佳荣, 赵祥模, 等. 基于车路协同的高速公路车辆碰撞预警模型[J]. 公路交通科技, 2017, 34(9): 123-129. https://www.cnki.com.cn/Article/CJFDTOTAL-GLJK201709018.htmYANG L, MA J R, ZHAO X M, et al. A vehicle collision warning model in expressway scenario based on vehicle-infrastructure cooperation[J]. Journal of Highway and Transportation Research and Development, 2017, 34(9): 123-129. (in Chinese) https://www.cnki.com.cn/Article/CJFDTOTAL-GLJK201709018.htm [19] BOCHKOVSKIY A, WANG C Y, LIAO H. YOLOv4: optimal speed and accuracy of object detection[EB/OL]. (2020-4-23)[2021-11-22]. https://arxiv.org/abs/2004.10934. [20] SUN Y M, CAO B, ZHU P F, et al. Drone-based RGB-infrared cross-modality vehicle detection via uncertainty-aware learning[EB/OL]. (2021-10-14)[2021-11-22]. https://arxiv.org/abs/2003.02437. [21] EVERINGHAM M, GOOL V L, WILLIAMS C K I, et al. The pascal visual object classes(VOC)challenge[J]. International Journal of Computer Vision, 2010, 88(2): 303-338. [22] WOJKE N, BEWLEY A, PAULUS D. Simple online and realtime tracking with a deep association metric[EB/OL]. (2017-3-21)[2021-11-22]. https://arxiv.org/abs/1703.07402. [23] AUTEYJ, SAYEDT, ZAKIMH. Safety evaluation ofright-turn smart channels using automated traffic conflict analysis[J]. Accident Analysis & Prevention, 2012, 45(2): 120-130. [24] 马艳丽, 祁首铭, 吴昊天, 等. 基于PET算法的匝道合流区交通冲突识别模型[J]. 交通运输系统工程与信息, 2018, 18 (2): 142-148. https://www.cnki.com.cn/Article/CJFDTOTAL-YSXT201802022.htmMA Y L, QI S M, WU H T, et al. Traffic conflict identification model based on post encroachment time algorithm in ramp merging area[J]. Journal of Transportation Systems Engineering and Information Technology, 2018, 18(2): 142-148. (in Chinese) https://www.cnki.com.cn/Article/CJFDTOTAL-YSXT201802022.htm -

 点击查看大图

计量
- 文章访问数: 1233
- HTML全文浏览量: 534
- PDF下载量: 79
- 被引次数: 0