

Development of Crash Prediction Models Involving Heavy-duty Trucks over Long Downhill Segments Considering Multi-mode Failure Probability
-
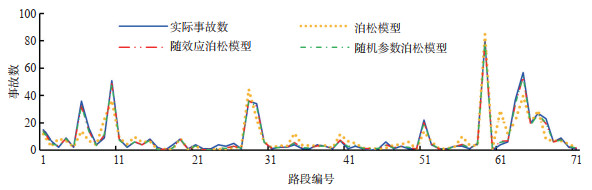
摘要: 为挖掘多模式失效概率与长下坡路段重型卡车事故之间的关系,建立了重型卡车在长下坡路段的多模式失效概率与车辆事故之间的关系模型。并针对重型卡车在长下坡路段可能的失效模式,如侧滑、侧翻、视距不足、制动失效,在此基础上建立了多模式失效概率预测模型;通过蒙特卡罗法模拟并求解单模式失效的概率,宽界限法求解失效系统的多模式失效概率;将多模式失效概率作为解释变量与其他道路因素结合,分别建立泊松模型、随机效应泊松模型、随机参数泊松模型,将多模式失效概率与重型卡车事故建立函数关系;对比3种模型的拟合优度指标,优选出最优事故预测模型,用来挖掘重型卡车事故与多模式失效概率之间的关系。以华盛顿州71段长下坡10年的重型卡车事故数据及道路设计数据进行方法验证。结果表明:随机参数泊松模型与随机效应泊松模型的拟合优度相差较小,二者均优于泊松模型;当考虑多模式失效概率时,平曲线半径、纵坡坡度、超高对重型卡车事故的影响均不显著,即三者的影响被削弱,尤其是平曲线半径和超高,多模式失效概率的弹性(0.239)远大于二者的弹性(平曲线半径和超高的弹性分别仅为0.097和0.002);重型卡车的事故与多模式失效概率近似线性关系,且截距不为0。即多模式失效概率可用于道路安全分析的表征指标,但与事故概率不等价。Abstract: A crash prediction model is developed, in order to explore the relationship between multi-mode failure probability and heavy-duty truck crashes over long downhill road sections. A model for multi-mode failure probability prediction is developed to study the probability of different types of failures associated with heavy-duty trucks, such as skidding, rollover, insufficient sight distance, and braking failure, on the long downhill sections. The single-mode failure probability is simulated using a Monte Carlo method and the multi-mode failure probability of the system is studied by a wide bound method. Three crash prediction models including a Poisson model, a random-effect Poisson model, and a random-parameter Poisson model are developed, considering multi-mode failure probability as one of the explanatory variables together with other impact factors. The models are used to link the multi-mode failure probability with the crashes of heavy-duty trucks. The optimal crash prediction model is selected through the goodness-of-fit for accurately modeling the relationship between crashes of the trucks and their multi-mode failure probability. The method is verified by a 10-year data of heavy-duty truck crash and road design of 71 long downhill sections in the Washington State, the United States. The results show that there is little difference in the goodness of fit between the random-effect Poisson model and random-parameter Poisson model, and both of them are better than the Poisson model. It is found that radius of the horizontal curves, grades and superelevation rates are not significant in leading to the crashes, when compared with the multi-mode failure probability. Study results show that, the elasticity of multi-mode failure probability (0.239) is much greater than that of the radius of horizontal curve and superelevation (0.097 and 0.002) respectively; heavy-duty truck crashes and multi-mode failure probability are approximately linearly correlated, and the intercept of the model is found to be other than "0". The above results indicate that the multi-mode failure probability can be used for road safety analysis, but it is not equivalent to the crash probability, which may be used as a basis for improving road design.
-

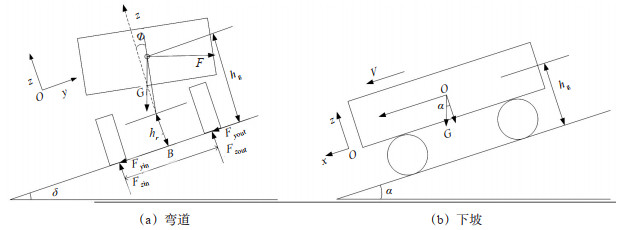
图 1 车辆在弯坡路段的受力分析
Figure 1. Force analysis of vehicles on combination sections of vertical and horizontal curve

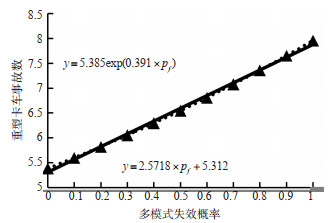
图 3 重型卡车事故数与多模式失效概率的关系
Figure 3. Relationship between heavy truck crash values and multi-mode failure probability
表 1 固定变量及取值
Table 1. Fixed variables and values
符号 变量解释 变量值 m 车辆的总重量/kg 20 000 m0 满载质量/kg 30 000 T0 制动器的初始温度/℃ 本文取130 g 重力加速度/(m/s2) 9.81 ρθ 空气密度/(kg/m3) 1.225 8 A2 重型车辆的迎风面积/m2 6 κ 车辆的空气阻力系数 1 z0 主传动比 5.833 zv 各档传动比 q 后轮制动器数 4 η 传动效率 0.83 m1 所有后轮承受质量之和/kg 总质量的90% γ 制动力分配系数/% 27.2 R1 后轮动力半径/m 0.515 R2 后轮滚动半径/m 0.527 m2 制动鼓质量/kg 62.268 A1 制动鼓的表面积/m2 0.347 c 制动鼓的比热容/(J/kg·℃) 482 系数 τ0 = m/m0;τ1 = 66.34;τ = 1.0475; τ2 = 0.050 1 L 路段长度/km hr/hg 0.25 rφ 侧倾率 0.05 B/2hg 0.58 μ2 湿滑路面提供的附着系数 0.4  下载: 导出CSV
表 2 变量的统计特征
Table 2. Statistical characteristics of variables
变量 均值 标准差 最大值 最小值 重型卡车事故数 9.085 14.602 80 0 暴露变量 路段长度/km 3.676 3.950 19.614 1.030 年平均日交通量/(辆/天) 146 33 250 64 165 789 531 交通情况变量 法定限速/(km/h) 84.416 15.623 112.63 40.225 卡车的百分比/% 12.788 8.959 38.949 0.184 道路设计参数 平曲线半径/m 0.416 0.438 2.329 0.011 纵坡/% 3.996 0.815 6.478 2.804 超高/% 1.646 3.231 10 0 多模式失效概率 0.391 0.311 1 0
下载: 导出CSV
表 3 考虑多模式失效概率的随机效应泊松模型估计结果
Table 3. estimation results of crash prediction model considering multi-mode failure probability
变里名称 泊松模型 随机效应泊松模型 随机参数泊松模型 系数值 标准误 P值 系数值 标准误 P值 系数值 标准误 P值 弹性 截距项 -9.595*** 0.711 0 -8.769*** 0.711 -8.315*** 0.719 0 参数分布标准差 0.585*** 0.049 0.250*** 0.042 暴露变量 路段长度的对数 0.124*** 0.011 0 0.142*** 0.012 0 0.138*** 0.012 0 0.506 年平均日交通量对数 0.967*** 0.055 0 0.941*** 0.058 0 0.903*** 0.059 0 7.805 参数分布标准差 0.057*** 0.005 交通情况变量 法定限速 0.015*** 0.004 0 0.006* 0.004 0.094 0.005 0.004 0.250 0.383 卡车的百分比 0.018** 0.009 0.037 0.029*** 0.009 0.001 0.032*** 0.009 0.001 0.412 道路设计参数 平曲线半径 -0.11 0.144 0.442 0.167 0.15 0.265 0.234 0.151 0.123 0.097 纵坡 0.182** 0.074 0.014 0.077 0.086 0.369 0.067 0.087 0.441 0.267 超高 -0.046*** 0.015 0.002 -0.007 0.016 0.642 0.001 0.016 0.934 0.002 多模式失效概率 0.459** 0.2 0.022 0.541** 0.212 0.011 0.610*** 0.215 0.005 0.239 样本数量 71 71 71 参数数量 9 10 11 对数似然值 -232.031 -183.496 -182.502 仅含常数项的对数似然值 -643.079 -1653.35 -1653.35 麦克费登, 0.639 0.889 0.89 A/C 482.1 387 387 MAD 4.077 1.02 1.012 均方根误差 6.613 1.346 1.316 注:***,**,* 分别表示在1%、5%和10%水平上显著。
下载: 导出CSV
-
[1] 张驰, 侯宇迪, 秦际涵, 等. 基于制动毂温升的连续下坡安全设计方法[J]. 华南理工大学学报(自然科学版), 2019, 47 (10): 139-150. https://www.cnki.com.cn/Article/CJFDTOTAL-HNLG201910016.htmZHANG C, HOU Y D, QIN J H, et al. Safety design method of long slope downhill slope based on temperature increase of brake drum[J]. Journal of South China University of Technology(Natural Science Edition), 2019, 47(10): 139-150. (in Chinese) https://www.cnki.com.cn/Article/CJFDTOTAL-HNLG201910016.htm [2] REZAPOUR M, MOOMEN M, KSAIBATI K. Ordered logistic models of influencing factors on crash injury severity of single and multiple-vehicle downgrade crashes: A case study in Wyoming[J]. Journal of Safety Research, 2019(68) 107-118. [3] 陈富坚, 邓伟建, 徐培培, 等. 弯坡组合路段可靠性设计方法研究[J]. 公路工程, 2017, 42(3): 98-105, 130. doi: 10.3969/j.issn.1674-0610.2017.03.021CHEN F J, DENG W J, XU P P, et al. Reliability design method for combination of vertical and horizontal curves[J]. Highway Engineering, 2017, 42(3): 98-105, 130. (in Chinese) doi: 10.3969/j.issn.1674-0610.2017.03.021 [4] 张航, 储泽宇, 吕能超, 等. 基于侧向稳定性的圆曲线路段设计指标研究[J]. 交通信息与安全, 2021, 39(2): 28-35. doi: 10.3963/j.jssn.1674-4861.2021.02.004ZHANG H, CHU Z Y, LYU N C, et al. Design indices of circular curve section based on lateral stability[J]. Journal of Transport Information and Safety, 2021, 39(2): 28-35. (in Chinese) doi: 10.3963/j.jssn.1674-4861.2021.02.004 [5] 中华人民共和国交通运输部. 公路工程技术标准: JTG B01—2014[S]. 北京: 人民交通出版社, 2015.Ministry of Transport of the People's Republic of China. Technical standard of highway engineering: JTG B01— 2014[S]. Beijing: China Communications Press, 2015. (in Chinese) [6] AASHTO (American Association of State Highway and Transportation Officials). A policy on geometric design of highways and streets[R]. Washington, D. C. : American Association of State Highway and Transportation Officials, 2004. [7] IBRABIM S E, SAYED T. Developing safety performance functions incorporating reliability-based risk measures[J]. Accident Analysis & Prevention, 2011, 43(6): 2153-2159. [8] IBRAHIM S E, SAYED T, ISMAIL K. Methodology for safety optimization of highway cross-sections for horizontal curves with restricted sight distance[J]. Accident Analysis & Prevention, 2012(49): 476-485. [9] SARHAN M, HASSAN Y. Three-dimensional, probabilistic highway design: Sight distance application[J]. Transportation Research Record Journal of the Transportation Research Board, 2008(2060): 10-18. [10] RICHL L, SAYED T. Evaluating the safety risk of narrow medians using reliability analysis[J]. Journal of Transportation Engineering, 2006, 132(5): 366-375. doi: 10.1061/(ASCE)0733-947X(2006)132:5(366) [11] YOU K, SUN L, GU W. Reliability-based risk analysis of roadway horizontal curves[J]. Journal of Transportation Engineering, 2012, 138(8): 1071-1081. doi: 10.1061/(ASCE)TE.1943-5436.0000402 [12] ESSAM, SAYEDT, HUSSEIN M. Multimode reliability-based design of horizontal curves[J]. Accident Analysis & Prevention, 2016(93): 124-134. [13] MANNERING F L, BHAT C R. Analytic methods in accident research: Methodological frontier and future directions[J]. Analytic Methods in Accident Research, 2014(1): 1-22. [14] MOOMEN M, REZAPOUR M, RAJA M, et al. Predicting downgrade crash frequency with the random-parameters negative binomial model: Insights into the impacts of geometric variables on downgrade crashes in Wyoming[J]. IATSS Research, 2020(44): 94-102. [15] HOU Q, TARKO A P, MENG X. Investigating factors of crash frequency with random effects and random parameters models: New insights from Chinese freeway study[J]. Accident Analysis & Prevention, 2018(120): 1-12. [16] MA Z, ZHANG H, CHIEN S I, et al. Predicting expressway crash frequency using a random effect negative binomial model: A case study in China[J]. Accident Analysis & Prevention, 2017(98): 214-222. [17] 张明. 结构可靠度分析: 方法与程序[M]. 北京: 科学出版社, 2009.ZHANG M. Structural reliability analysis: methods and procedures[M]. Beijing: Science Press, 2009. (in Chinese) [18] 刘远才, 游润东, 杨永红. 道路勘测设计[M]. 北京: 中国电力出版社, 2010.LIU Y C, YOU R D, YANG Y H. Road survey and design[M]. Beijing: China Electric Power Press, 2010. (in Chinese) [19] 游克思. 基于车辆动力学和可靠性理论的道路安全分析及优化设计研究[D]. 南京: 东南大学, 2012.YOU K S. Vehicle dynamics and reliability based highway safety analysis and design optimization[D]. Nanjing: Southeast University, 2012. (in Chinese) [20] DENG T, FU J, SHAO Y. Pedal operation characteristics and driving workload on slopes of mountainous road based on naturalistic driving tests[J]. Safety Science, 2019(119): 40-49. [21] 苏波. 大货车持续制动性能与山区高速公路纵坡优化设计研究[D]. 上海: 同济大学, 2009.SU B. Research on continuous braking performance of truck and optimization design of longitudinal slope of expressway in mountainous area[D]. Shanghai: Tongji University, 2009. (in Chinese) [22] 肖润谋, 叶燕仙, 周晓悦, 等. 发动机制动失效的坡长临界值计算[J]. 交通运输工程学报, 2006, 6(4): 122-126. doi: 10.3321/j.issn:1671-1637.2006.04.027XIAO R M, YE Y X, ZHOU X R, et al. Critical slope length computation of engine brake inefficacy[J]. Journal of Traffic and Transportation Engineering, 2006, 6(4): 122-126. (in Chinese) doi: 10.3321/j.issn:1671-1637.2006.04.027 [23] 周荣贵. 公路纵坡坡度与坡长限制的研究[D]. 北京: 北京工业大学, 2004.ZHOU R G. Study on highway longitudinal gradient and grade length limit[D]. Beijing: Beijing University of Technology, 2004. (in Chinese) [24] 王晓安, 李志中, 计斌, 等. 山区双车道公路平曲线路段运行速度预测模型研究[J]. 黑龙江交通科技, 2015, 38(7): 4-6. doi: 10.3969/j.issn.1008-3383.2015.07.003WANG X A, LI Z Z, JI B, et al. Study on the prediction operating speed model on the mountainous two-lane highway horizontal curve section[J]. Communications Science and Technology Heilongjiang, 2015, 38(7): 4-6. (in Chinese) doi: 10.3969/j.issn.1008-3383.2015.07.003 [25] LORDD, MANNERING F. The statistical analysis of crash-frequency data: A review and assessment of methodological alternatives[J]. Transportation Research Part A: Policy and Practice, 2010, 44(5): 291-305. doi: 10.1016/j.tra.2010.02.001 [26] WASHINGTON S P, KARLAFTIS M G, MANNERING F. Statistical and econometric methods for transportation data analysis[M]. New York: CRC Press, 2010. [27] 胡江碧, 李晓宇, 罗绍建, 等. 基于驾驶行为需求的长大纵坡界定[J]. 北京理工大学学报, 2017, 37(6): 590-594. https://www.cnki.com.cn/Article/CJFDTOTAL-BJLG201706008.htmHU J B, LI X Y, LUO S J. et al. The definition of long steep downgrade based on driver behavior[J]. Transactions of Beijing Institute of Technology, 2017, 37(6): 590-594. (in Chinese) https://www.cnki.com.cn/Article/CJFDTOTAL-BJLG201706008.htm [28] 郑晓. 基于货车制动性能的长大下坡行车风险分析及防控措施[D]. 西安: 长安大学, 2014.ZHENG X. Research on risk analysis of driving and prevention measures for the long-steep downgrade based on truck braking performance[D]. Xi'an: Chang'an University, 2014. (in Chinese) -

 点击查看大图
计量
- 文章访问数: 2574
- HTML全文浏览量: 1700
- PDF下载量: 139
- 被引次数: 0