

An Analysis and Forecasting of Air Cargo Volume in China Under the Impacts of COVID-19 Epidemic
-
摘要: 在新型冠状病毒肺炎疫情对航空货运的影响下,月度航空货运量出现异于历史趋势的极端数据,而传统航空货运量预测模型有在极端数据影响下误差较大的问题。因此,研究了适用于后疫情时代的中国航空货运量短期预测方法。对2009—2020年中国航空货运量月度数据进行分析,发现中国航空货运量呈稳定增长趋势。受疫情影响出现短期剧烈波动,在假设疫情对航空货运的影响逐渐减弱的前提下,选取Holt-Winters乘法模型与求和自回归移动平均ARIMA乘积季节模型分别提取航空货运量数据的长期趋势、周期特征和短期波动特征,并采用4种不同权重确定方法构建了多个航空货运量组合预测模型。运用Holt-Winter模型、ARIMA模型及其组合预测模型对2021—2022年中国航空月度货运量进行了预测,以2021年1月—5月的航空货运量数据作为验证数据集,对比分析了不同预测模型的预测误差。结果表明:Holt-Winters与ARIMA组合预测模型的平均绝对百分比误差与最大绝对百分比误差普遍小于自身单一模型的;基于最小二乘法赋权的组合模型预测效果最优,基于残差倒数法赋权的组合模型预测效果次优;最优组合模型的平均绝对百分比误差为1.93%,比次优组合模型降低了8.53%,较单一的Holt-Winters模型与ARIMA模型分别降低了71.70%与20.58%,验证了最优组合模型对后疫情时代中国航空货运量月度数据预测的有效性。
-
关键词:
- 航空运输 /
- 航空货运量预测 /
- Holt-Winters乘法模型 /
- ARIMA乘积季节模型 /
- 组合预测 /
- 新型冠状病毒肺炎疫情
Abstract: With the impacts of COVID-19 epidemic on air cargo market, monthly air cargo volumedata in China shows extreme values, whichare inconsistent with historical trends. As traditional forecasting modelsof air cargo volume are susceptible to large errors due to extreme data, several short-term forecastingmethodsare proposed and developed to forecast air cargo volume in the post-epidemic era of China. It is found thatair cargo volume in China under the influence of COVID-19 epidemic has a steady growth upward trend along with a significant, short-term fluctuation after analyzing the monthly data of air cargo volume in China from 2009 to 2020. Assuming the impactsof COVID-19 epidemic on air cargo decrease gradually, Holt-Winters multiplication model and autoregressive integrating moving average (ARIMA) multiplication seasonal model are applied to model the long-term trend, periodic characteristic, and short-term fluctuation of air cargo quantities respectively. In addition, four different methods for selecting the weights are applied to these two models, in order todevelop combined forecasting models of air cargo volume. Holt-Winter model, ARIMA model, and the combined forecasting model based on the two techniques are used to forecast monthly domestic air cargo volume from 2021 to 2022. The forecasting errors of these models are compared and analyzed based on domestic air cargo volume data from January to May in 2021. The results show that the average absolute percentage error (AAPE) and the maximum absolute percentage error (MAPE) of the Holt-Winters and ARIMA combined model are generally smaller than those of any single model. The combined model weighted by the least square method is found to be most accurate, while itthat based on weights determined by residual reciprocal method is ranked second. The AAPEof the combined model is 1.93%, which is reduced by 8.53% whencompared with the combined model ranked second, and is 71.70% and 20.58% lower than that of single Holt-Winters and ARIMA model. Therefore, the effectiveness and accuracy of the optimized, combined model in forecasting the monthly domestic air cargo volume within the post-epidemic era has been verified. -

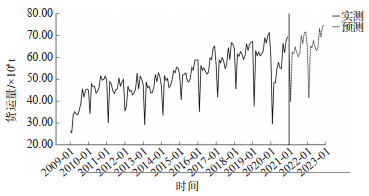
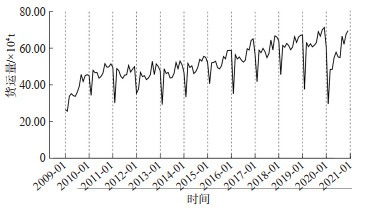
图 1 2009—2020年中国航空货运量月度数据时序图
Figure 1. Time sequence diagram of monthly data of Chinese air cargo volume from 2009 to 2020

图 2 Holt-Winters乘法模型预测结果
Figure 2. Prediction results of Holt-Winters multiplication model

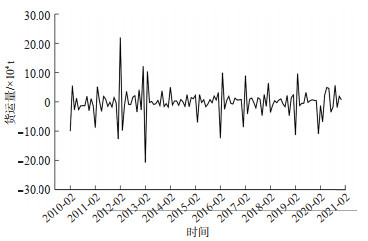
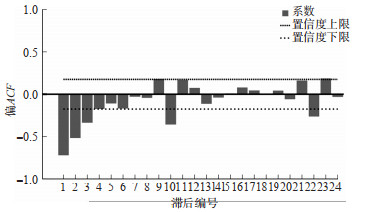
图 3 运输量一阶差分、一阶季节差分图
Figure 3. 1st difference and 1st seasonal difference diagram of transportation volume

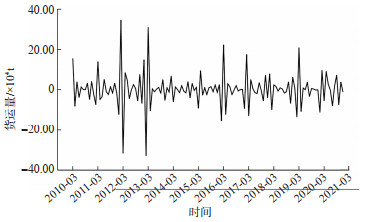
图 4 运输量二阶差分、一阶季节差分图
Figure 4. 2nd difference and 1st seasonal difference diagram of transportation volume

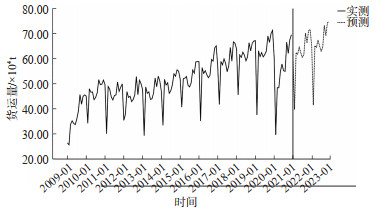
图 7 ARIMA(1, 2, 2)(0, 1, 2)12 模型预测结果
Figure 7. Forecasting results of ARIMA(1, 2, 2)(0, 1, 2)12 model
表 1 2009—2020年中国航空货运量月度数据
Table 1. Monthly data of Chinese air cargo volume from 2009 to 2020
单位: 10 000 t 年份 月度货运量 1 2 3 4 5 6 7 8 9 10 11 12 2009 26.43 25.64 33.83 35.21 34.13 33.72 35.99 39.08 45.65 41.83 45.00 45.54 2010 45.07 34.27 47.96 46.60 46.73 43.63 44.54 46.32 51.57 49.64 49.82 51.45 2011 49.65 30.07 48.90 47.83 44.74 43.51 45.29 45.53 50.65 46.94 48.59 49.92 2012 35.42 37.77 46.84 44.53 44.99 42.86 43.73 45.56 52.79 45.62 51.40 50.01 2013 47.66 29.31 48.72 46.17 46.78 43.76 43.97 46.31 52.23 48.80 53.00 51.00 2014 46.80 33.40 51.73 49.47 50.39 46.17 47.19 49.56 53.93 52.96 55.53 55.00 2015 51.86 40.69 52.00 52.22 52.89 49.39 48.72 50.36 55.48 54.17 58.71 58.80 2016 58.80 35.20 56.40 54.10 55.20 53.60 52.40 53.30 59.70 59.00 64.20 65.10 2017 56.50 41.80 58.90 57.50 59.90 58.10 54.80 57.10 64.40 59.00 66.70 66.10 2018 63.90 45.60 61.50 60.50 62.60 61.40 59.10 60.70 66.30 63.10 66.10 67.00 2019 67.20 37.60 63.10 60.80 62.40 60.70 61.60 63.00 69.00 66.50 70.00 71.30 2020 60.60 29.70 48.40 48.40 54.90 57.80 55.20 54.90 66.50 62.10 67.50 69.50  下载: 导出CSV
表 2 Holt-Winters乘法模型统计
Table 2. Statistical test of Holt-Winters multiplication model
模型拟合度统计 杨-博克斯Q(18)检验 平稳R2 R2 MAPE /% 统计 DF 显著性 0.625 0.908 4.536 20.285 15 0.161
下载: 导出CSV
表 3 2021年和2022年航空货运量预测值(Holt-Winters乘法模型)
Table 3. Forecasting results of air cargo volume in 2021 and 2022 (with Holt-Winters multiplication model)
年份 月份 预测值/x104t 年份 月份 预测值/x104t 2021 1 61.92 2022 1 64.65 2 39.75 2 41.50 3 62.37 3 65.12 4 61.79 4 64.51 5 64.52 5 67.35 6 62.33 6 65.06 7 60.38 7 63.02 8 61.78 8 64.47 9 70.11 9 73.16 10 66.34 10 69.22 11 71.17 11 74.25 12 71.54 12 74.64
下载: 导出CSV
表 4 备选模型的检验
Table 4. Verification of alternative models
模型参数 R2 正态化BIC (1, 2, 2)(0, 1, 2)12 0.928 2.276 (1, 2, 2)(1, 1, 2)12 0.928 2.317 (1, 2, 1)(0, 1, 2)12 0.906 2.450 (1, 2, 1)(1, 1, 2)12 0.919 2.440 (2, 2, 1)(0,1,2)12 0.927 2.333 (2, 2, 1)(1, 1, 2)12 0.922 2.401 (2, 2, 2)(0, 1, 2)12 0.950 2.281 (2, 2, 2(0, 1, 2)12 0.908 2.556
下载: 导出CSV
表 5 ARIMA(1, 2, 2)(0, 1, 2)12 模型统计
Table 5. Statistical test of ARIMA (1, 2, 2)(0, 1, 2)12 model
模型拟合度统计 杨-博克斯Q(18)检验 平稳R2 R2 MAPE /% 统计 DF 显著性 0.921 0.928 3.248 10.215 13 0.676
下载: 导出CSV
表 6 2021年和2022年的航空货运量预测值(ARIMA(1, 2, 2)(0, 1, 2)12)
Table 6. Forecasting results of air cargo volume in 2021 and 2022 (ARIMA (1, 2, 2)(0, 1, 2)12)
年份 月份 预测值/xl04t 年份 月份 预测值/xl04t 2021 1 65.64 2022 l 70.7 2 49.37 2 55.23 3 65.79 3 71.37 4 64.24 4 69.6 5 66.62 5 72.35 6 65.59 6 71.78 7 64.39 7 70.28 8 65.71 8 71.28 9 72.82 9 79.16 10 69.73 10 75.94 11 74.34 11 80.76 12 75.38 12 82.14
下载: 导出CSV
表 7 组合模型权重分配
Table 7. Weight distribution of combined model
模型 赋权方法 Holt-Winters乘法模型 arima乘积季节模型 组合模型l 等权平均法 0.50 0.50 组合模型2 方差倒数法 0.42 0.58 组合模型3 残差倒数法 0.39 0.61 组合模型4 最小二乘法 0.30 0.70
下载: 导出CSV
表 8 各模型预测结果对比
Table 8. Comparison of forecasting results of all models
单位: 10 000 t 时间 实际值 arima乘积季节模型 Holt-Winters乘法模型 组合模型1 组合模型2 组合模型3 组合模型4 1月 66.90 65.64 61.92 63.78 64.08 64.19 64.53 2月 45.90 49.37 39.75 44.56 45.33 45.62 46.51 3月 65.50 65.79 62.37 64.08 64.35 64.46 64.77 4月 65.50 64.24 61.79 63.02 63.21 63.28 63.51 5月 66.40 66.62 64.52 65.57 65.74 65.80 66.00
下载: 导出CSV
表 9 各模型误差比较
Table 9. Comparison of model errors
模型名称 MAPE /% 最大绝对百分比误差/% ARIMA乘积季节模型 2.43 7.56 Holt-Winters乘法模型 6.82 13.40 组合模型1 2.96 4.66 组合模型2 2.34 4.22 组合模型3 2.11 4.05 组合模型4 1.93 3.54
下载: 导出CSV
表 10 中国航空货运量预测结果(组合模型4)
Table 10. Forecasting results of air cargo volume in China (combined model 4)
年份 月份 预测值/x104t 年份 月份 预测值/x104t 2021 1 2022 1 68.89 2 2 51.11 3 3 69.50 4 4 68.07 5 5 70.85 6 64.61 6 69.76 7 63.19 7 68.10 8 64.53 8 69.24 9 72.01 9 77.36 10 68.71 10 73.92 11 73.39 11 78.81 12 74.23 12 79.89
下载: 导出CSV
-
[1] 赵瑜. 航空货运为何"一舱难求"?[N]. 中国民航报, 2021-08-12(5).ZHAO Y. Why is air cargo "difficult to find cargo space"?[N]. China Civil Aviation News, 2021-08-12(5). (in Chinese) [2] GUDMUNDSSON S V, CATTANEO M, REDONDI R. Forecasting temporal world recovery in air transport markets in the presence of large economic shocks: The case of COVID-19[J]. Journal of Air Transport Management, 2021(91): 102007. [3] 周叶, 肖灵机. 基于ARIMA模型的中国航空货运量预测分析[J]. 南昌航空大学学报(社会科学版), 2010, 12(3): 22-27. doi: 10.3969/j.issn.1009-1912.2010.03.004ZHOU Y, XIAO L J. Prediction and analysis of China's air cargo volume based on ARIMA model[J]. Journal of Nanchang Aviation University(Social Science Edition), 2010, 12(3): 22-27. (in Chinese) doi: 10.3969/j.issn.1009-1912.2010.03.004 [4] 文军. 基于灰色马尔可夫链模型的航空货运量预测研究[J]. 武汉理工大学学报(交通科学与工程版), 2010, 34 (4): 695-698. doi: 10.3963/j.issn.1006-2823.2010.04.013WEN J. Research on air freight volume forecast based on grey Markov chain model[J]. Journal of Wuhan University of Technology(Transportion Science & Engineering), 2010, 34(4): 695-698. (in Chinese) doi: 10.3963/j.issn.1006-2823.2010.04.013 [5] 朱倩, 廖志高, 张峰祎. 基于聚类算法和ANFIS的广西航空货运量预测研究[J]. 武汉理工大学学报, 2015, 37(8): 37-41. https://www.cnki.com.cn/Article/CJFDTOTAL-WHGY201508009.htmZHU Q, LIAO Z G, ZHANG F Y. Research on Guangxi air freight volume forecast based on clustering algorithm and ANFIS[J]. Journal of Wuhan University of Technology, 2015, 37(8): 37-41. (in Chinese) https://www.cnki.com.cn/Article/CJFDTOTAL-WHGY201508009.htm [6] 汤银英, 李龙. 基于Holt-Winters模型的铁路月度货运量预测研究[J]. 交通运输工程与信息学报, 2017, 15(2): 1-5+13. doi: 10.3969/j.issn.1672-4747.2017.02.001TANG Y Y, LI L. Research on railway monthly freight volume prediction based on Holt winters model[J]. Journal of Transportation Engineering and Information, 2017, 15(2): 1-5+13. (in Chinese) doi: 10.3969/j.issn.1672-4747.2017.02.001 [7] LIU J M, DING L, GUAN X Y, et al. Comparative analysis of forecasting for air cargo volume: Statistical techniques vs. machine learning[J]. Journal of Data, Information and Management, 2020, 2(4): 243-255. doi: 10.1007/s42488-020-00031-1 [8] MANCUSO A C B, Werner L. A comparative study on combinations of forecasts and their individual forecasts by means of simulated series[J]. Acta Scientiarum Technology, 2019, 41(1): 41452. doi: 10.4025/actascitechnol.v41i1.41452 [9] BLANC S M, SETZER T. Bias-Variance trad-off and shrinkage of weights in forecast combination[J]. Management Science, 2020, 66(12): 1-18. [10] SALISU A, SHABRI A, ISMAIL Z. A combine Holt-Win-ters and support vector machines models in forecasting airlines seasonal time series data[J]. Mathematics and Statistics Journal, 2015, 1(4): 8-16. [11] TAMBER A J, MICHAEL O O, Ojowu O J. The Holt-Win-ters multiplicative model of passengers' traffic forecast of the Nigeria airports[J]. International Journal of Electrical and Computer Systems, 2021, 3(1): 35-40. [12] YANG Y M, YU H, SUN Z. Aircraft failure rate forecasting method based on Holt-Winters seasonal model[C]. 2017 IEEE 2nd International Conference on Cloud Computing and Big Data Analysis(ICCCBDA), Chengdu, China: IEEE, 2017. [13] SIAMI-NAMINI S, TAVAKOLI N, NAMIN A S. A comparison of ARIMA and LSTM in forecasting time series[C]. 2018 17th IEEE International Conference on Machine Learning and Applications(ICMLA), Orlando, USA: IEEE, 2018. [14] 陈希睿. 基于时间序列分析的CPI预测[D]. 北京: 清华大学, 2019.CHEN X R. CPI prediction based on time series analysis[D]. Beijing: Tsinghua University, 2019. (in Chinese) [15] DUBEY A K, KUMAR A, GARCÍA-DÍAZ V, et al. Study and analysis of SARIMA and LSTM in forecasting time series data[J]. Sustainable Energy Technologies and Assess-ments, 2021(47): 101474 [16] 薛艳茹. 基于时间序列分析的散杂货港口吞吐量短期预测研究[D]. 北京: 北京交通大学, 2019.XUE Y R. Research on short-term forecast of bulk cargo port throughput based on time series analysis[D]. Beijing: Beijing Jiaotong University, 2019. (in Chinese) [17] GUO Y H, SHI X P, ZHANG X D. A study of short term forecasting of the railway freight volume in China using ARIMA and Holt-Winters models[C]2010 8th International Conference on Supply Chain Management and Information, Hong Kong, China: The Hong Kong Polytechnic University, 2010. [18] 詹英. 组合预测方法在中国人均GDP预测中的应用[D]. 武汉: 华中师范大学, 2014.ZHAN Y. Application of combination forecasting method in China's per capita GDP forecast[D]. Wuhan: Huazhong Normal University, 2014. (in Chinese) [19] 中国民用航空局. 月度生产运输统计[R/OL]. (2021-12)[2022-01-04]. http://www.caac.gov.cn/XXGK/XXGK/index_172.html?fl=11.Civil Aviation Administration of China. Monthly production and transportation statistics[R/OL]. (2021-12)[2022-01-04]. http://www.caac.gov.cn/XXGK/XXGK/index_172.html?fl=11. (in Chinese) [20] 易丹辉. 统计预测: 方法与应用[M]. 北京: 中国人民大学出版社, 2014: 212-267.YI D H. Statistical prediction: methods and applications[M]. Beijing: China Renmin University Press, 2014: 212-267. (in Chinese) -

 点击查看大图
计量
- 文章访问数: 1073
- HTML全文浏览量: 511
- PDF下载量: 156
- 被引次数: 0