

Assessment of Level of Concentration and Intake Quantity of Particulate Matter Within the Space of Various Travel Modes
-
摘要: 为了提高居民出行健康,建立了评估出行者采用不同出行方式时的PM人体摄入量估算方法体系。使用PM检测仪采集各出行方式(步行、自行车、公交、出租车、地铁)不同交通空间(包括车厢、站台、人行道等出行者在出行过程中身处的周围环境空间)的PM浓度,建立了基于多元线性回归的PM浓度与影响因素的关系模型,并考虑出行个体心率指标的变化建立空气吸入量模型。根据出行者的单位时间空气吸入量并结合出行时间和PM浓度,可对出行者1次完整出行中PM2.5和PM10摄入量进行估算。西安市的试验数据分析结果表明:出租车内、公交车厢、地铁车厢的PM浓度与环境监测站(即背景环境)获得的PM浓度存在显著性差异,人行道、非机动车道、出租车停靠点、公交站台、地铁站厅、地铁站台的PM浓度则差异不显著;背景环境的PM浓度和湿度对不同出行方式交通空间的PM浓度的增加起到促进作用,温度、风速对交通空间PM浓度的增加起到抑制作用;对于本次试验路径,慢行交通中自行车出行者的PM摄入量最低,机动化交通中乘坐地铁的出行者的PM摄入量最低;步行出行者的单位时间空气吸入量低但暴露在交通空间的时间长,自行车出行者单位时间空气吸入量高但暴露在交通空间的时间短;公交的站台候车和频繁停车增加了人体的PM摄入量。研究成果可用于预测出行者完整出行的PM摄入量,为出行者选择更为健康的出行方式提供建议。Abstract: In order to improve travel health of residents, an assessment system is established to evaluate travelers'intake quantity of particulate matter (PM) when traveling with different travel modes. A multiple linear regression model is developed to study the factors that have an impact onto the PM concentration using data collected at the space used by different travel modes (i.e., the surroundings of travelers when traveling using different travel modes, such as carriage, platform, or sidewalk) through PM detectors. A air intake model is developed considering the changes of heart rate index of travelers. Intake quantity of PM2.5 and PM10 over a single trip for a given traveler can be estimated based on air intake per unit time, travel time and PM concentration. Analysis results based on experimental data from Xi'an show that compared to data from environmental monitoring stations (background environment), there is a significant difference for the PM concentration detected in taxi, bus carriage and subway carriage, while the difference is not significant for the PM concentration detected in sidewalk, non-motorized lane, taxi stop, bus stop, subway station hall and subway platform. In addition, study results also show that the PM concentration and humidity in background environment have a positive influence on the increase of PM concentration in the space used by various travel modes, while temperature and wind speed have negative impacts. For this specific test route, travelers taking bicycle and subway show the lowest PM intake quantity among non-active and active travel modes, respectively. Walking-travelers have lower air intake per unit time but longer exposure time to traffic space, bicycle-travelers have higher air intake per unit time but shorter exposure time to traffic space. Waiting for the bus on the platform and buses'frequent stops contribute to the travelers'PM intake quantity which using bus service for travel. The results of the study can be used to predict the travelers'PM intake quantity in completed trips and based on those provide suggestions for travelers to choose healthier travel mode.
-

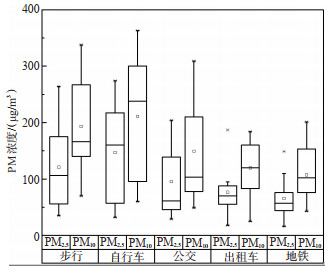
图 2 各出行方式交通空间PM浓度对比
Figure 2. Comparison of PM concentrations between various travel modes outside the exposed environment

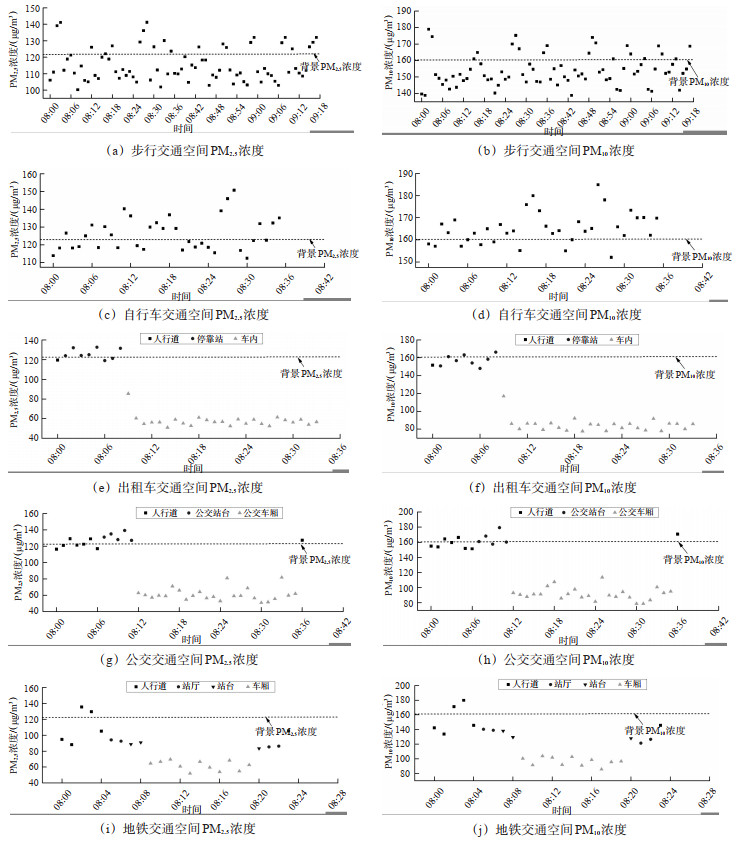
图 3 各出行方式交通空间PM浓度的时空轨迹
Figure 3. Temporal and spatial trajectory of PM concentrations of the selected travel modes outside the exposed environment
表 1 PM浓度差异显著性检验
Table 1. Results of the difference significance test of the PM concentration
不同出行方式的交通空间 P值 PM2.5 PM10 人行道 0.761 0.783 非机动车道 0.728 0.717 出租车停靠点 0.787 0.768 出租车内 0.003** 0.003** 公交站台 0.682 0.652 公交车厢 0.002** 0.003** 地铁站厅 0.705 0.726 地铁站台 0.522 0.603 地铁车厢 0.006** 0.009** 注:**在0.01水平下(双尾),差异性显著。  下载: 导出CSV
表 2 指标显著性统计
Table 2. Statistical significance of selected indicators
因变量 自变量 步行 自行车 出租车 公交 地铁 Sig. F F Sig. F F Sig. F F Sig. F F Sig. F F PM2.5浓度/(ug/m3) 人流量/(人/h) 0.738 130.4 0.523 144.1 0.641 132.6 0.719 141.8 0.774 139.7 车流量/(veh/h) 0.612 121.7 0.431 141.4 0.662 134.3 0.728 133.8 0.762 142.9 载客量/人 0.706 146.5 0.684 148.1 绿化 0.365 88.4 0.316 76.8 0.407 90.3 0.396 81.7 背景环境PM2.5浓度/(ug/m3) 0.006 32.8 0.007 35.1 0.014 40.5 0.013 36.6 0.022 48.3 温度/t 0.011 43.6 0.016 52.3 0.022 49.2 0.016 41.7 0.034 56.8 湿度/%rh 0.014 51.2 0.021 52.7 0.019 45.7 0.024 38.2 0.630 54.3 风速(m/s) 0.009 42.7 0.012 46.8 0.531 51.9 0.502 40.8 0.626 42.9 监测站位置/km 0.028 21.3 0.023 30.9 0.039 31.1 0.042 40.8 0.048 51.7 PM10浓度/(ug/m3) 人流量/(人/h) 0.724 128.9 0.525 146.2 0.655 133.8 0.716 140.6 0.782 142.8 车流量(veh/h) 0.617 128.5 0.426 138.7 0.660 129.6 0.721 139.2 0.763 142.1 载客量/人 0.711 148.3 0.686 152.7 绿化 0.359 86.5 0.317 74.2 0.411 91.5 0.388 76.5 背景环境PM10浓度/(ug/m3) 0.006 31.3 0.008 34.9 0.013 38.2 0.011 37.2 0.021 39.7 温度/t 0.012 45.1 0.016 53.4 0.024 43.6 0.015 38.4 0.036 48.2 湿度/%rh 0.015 50.5 0.019 48.5 0.016 41.9 0.020 43.6 0.628 53.9 风速(m/s) 0.010 43.9 0.014 47.6 0.628 49.3 0.616 39.3 0.527 40.6 监测站位置/km 0.019 19.3 0.027 26.8 0.043 53.2 0.036 46.1 0.040 33.9
下载: 导出CSV
表 3 多元回归参数估计值
Table 3. Estimation of the parameters in the multiple regression
出行方式 不同影响因素的回归系数 拟合优度R2 背景环境PM浓度(ug/m3) 温度/℃ 湿度/%rh 风速(m/s) 监测站位置/km 常数项 PM2.5 步行 1.103 -0.172 0.011 -0.088 -0.014 8.682 0.881 自行车 1.098 -0.101 0.079 -0.046 -0.019 19.307 0.826 公交 0.637 -0.075 0.153 -0.010 27.611 0.782 出租车 0.599 -0.026 0.062 -0.008 16.420 0.810 地铁 0.546 -0.018 -0.003 3.606 0.871 PM10 步行 1.201 -0.137 0.138 -0.086 -0.017 7.402 0.766 自行车 1.149 -0.109 0.149 -0.102 -0.020 16.507 0.703 公交 0.762 -0.071 0.066 -0.013 -18.006 0.818 出租车 0.668 -0.048 0.037 -0.009 9.312 0.711 地铁 0.673 -0.046 -0.006 5.225 0.768
下载: 导出CSV
表 4 5种出行方式单位时间空气吸入量
Table 4. Air intake per unit time of five travel modes
出行方式 交通空间 心率(beat/min) 单位时间空气吸人量/(L/min) 均值 标准差 最小 最大 均值 标准差 最小 最大 步行 人行道 88.9 4.4 74 93 17.2 2.7 12.4 18.8 自行车 非机动车道 109.8 10.2 70 129 27.3 3.0 11.4 41.6 人行道 88.9 4.4 76 102 17.2 2.7 13.0 23.0 公交 公交站台 71.7 4.3 61 77 11.8 2.7 9.3 13.3 公交车内 67.0 2.5 62 79 10.6 2.6 9.5 13.8 人行道 88.9 4.4 76 102 17.2 2.7 13.0 23.0 出租车 候车点 70.2 3.7 61 76 11.4 2.6 9.3 13.0 出租车内 65.4 2.3 59 73 10.3 2.6 8.9 12.1 人行道 88.9 4.4 76 102 17.2 2.7 13.0 23.0 地铁 站厅 78.7 4.7 66 90 13.7 2.7 10.4 17.6 站台 69.9 2.7 65 75 11.3 2.6 10.2 12.7 地铁车厢 72.6 3.1 67 81 12.0 2.6 10.6 14.5
下载: 导出CSV
表 5 不同出行方式平均PM摄入量
Table 5. Average PM inhalation dose of different travel modes
单位: ug 出行方式 交通空间 PM2.5 PM10 步行 人行道 180.8±101.2 259.3±110.9 自行车 非机动车道 136.5±71.3 190.1±80.8 人行道 14.9±9.7 20.4±9.8 公交 公交站台 9.7±7.0 13.5±8.8 公交车 28.1±11.7 41.4±16.6 全程 52.7±25.0 75.3±29.8 人行道 4.8±2.7 6.6±2.7 出租车 候车点 12.3±10.3 16.8±10.2 出租车 20.5±12.9 29.5±17.9 全程 37.6±20.5 52.9±24.4 人行道 12.3±7.8 16.9±8.0 站厅 6.7±3.5 10.0±5.2 地铁 站台 4.7±2.4 7.1±3.7 地铁车厢 9.1±4.5 12.7±6.4 全程 32.9±17.3 46.7±22.1
下载: 导出CSV
-
[1] JOHANNESSON S, ANDERSSON E, STOCKFELT L, et al. Urban air pollution and effects on biomarkers of systemic inflammation and coagulation: A panel study in healthy adults[J]. Inhalation toxicology, 2014, 26(2): 84-94. doi: 10.3109/08958378.2013.856968 [2] ZHU C H, FU Z K, LIU L J, et al. Health risk assessment of PM2.5 on walking trips[J]. Scientific Reports, 2021, 11(1): 19249. doi: 10.1038/s41598-021-98844-6 [3] LI Y, ZHOU W H, NAN S R, et al. Redesign of the cross-section of bicycle lanes considering electric bicycles[J]. Proceedings of the Institution of Civil Engineers, 2017, 170(tr5): 255-266. [4] SHI L, ZANOBETTI A, KLOOG I, et al. Low-concentration PM2.5 and mortality: Estimating acute and chronic effects in a population-based study[J]. Environmental Health Perspectives, 2016, 124(1): 46-52. doi: 10.1289/ehp.1409111 [5] PATRICK A, PIERRE S, ALESSANDRA D M, et al. Long-term exposure to ambient PM2.5 and impacts on health in rome, Italy[J]. Clinical Epidemiology & Global Health, 2020, 8(2): 531-545. [6] 李嘉琛, 王裕, 王童, 等. 不同出行方式PM2.5个体暴露水平的比较研究[J]. 环境与健康杂志, 2016, 33(8): 659-662. https://www.cnki.com.cn/Article/CJFDTOTAL-HJYJ201608001.htmLI J C, WANG Y, WANG T, et al. Comparison of personal exposure to PM2.5 by different commuting modes[J]. Journal of Environment and Health, 2016, 33(8): 659-662. (in Chinese) https://www.cnki.com.cn/Article/CJFDTOTAL-HJYJ201608001.htm [7] MANOJKUMAR N, MONISHRAJ M, SRIMURUGANANDAM B. Commuter exposure concentrations and inhalation doses in traffic and residential routes of Vellore city, India[J]. Atmospheric Pollution Research, 2021, 12(1): 219-230. doi: 10.1016/j.apr.2020.09.002 [8] QIU Z W, SONG J H, XU X Q, et al. Commuter exposure to particulate matter for different transportation modes in Xi'an, China[J]. Atmospheric Pollution Research, 2017, 8(5): 940-948. doi: 10.1016/j.apr.2017.03.005 [9] ZALUSKA M, GLADYSZEWSKA F K. Regression model of PM2.5 concentration in a single-family house[J]. Sustainability, 2020, 12(15): 5952. doi: 10.3390/su12155952 [10] SHIN H H, GOGNA P, MAQUILING A, et al. Comparison of hospitalization and mortality associated with short-term exposure to ambient ozone and PM2.5 in Canada[J]. Chemosphere, 2021(265): 128683. [11] 刘小宇, 盛萍, 马晓凤, 等. 城市高密集人群区域机动车污染物时空分布及健康影响[J]. 交通信息与安全, 2018, 36 (1): 119-128. doi: 10.3963/j.issn.1674-4861.2018.01.016LIU X Y, SHENG P, MA X F, et al. Temporal and spatial distribution and health risks of vehicle pollution in high-populated urban areas[J]. Journal of Transport Information and Safety, 2018, 36(1): 119-128. (in Chinese) doi: 10.3963/j.issn.1674-4861.2018.01.016 [12] 赵淑婷, 王丽涛, 齐孟姚, 等. 邯郸市PM2.5-O3复合污染特征及相互影响研究[J]. 环境科学学报, 2021, 41(6): 2250-2261. https://www.cnki.com.cn/Article/CJFDTOTAL-HJXX202106020.htmZHAO S T, WANG L T, QI M Y, et al. Study on the characteristics and mutual influence of PM2.5-O3 complex pollution in Handan[J]. Acta Scientiae Circumstantiae, 2021, 41(6): 2250-2261. (in Chinese) https://www.cnki.com.cn/Article/CJFDTOTAL-HJXX202106020.htm [13] 苏志华, 王建华. 贵阳市大气颗粒物的污染特征及其影响因素分析[J]. 中山大学学报(自然科学版), 2015, 54(5): 77-84. https://www.cnki.com.cn/Article/CJFDTOTAL-ZSDZ201505016.htmSU Z H, WANG J H. Pollution characteristics and determinants of atmospheric particulate matter and its determinants in Guiyang[J]. Acta Scientiarum Naturalium Universitatis Sunyatseni, 2015, 54(5): 77-84. (in Chinese) https://www.cnki.com.cn/Article/CJFDTOTAL-ZSDZ201505016.htm [14] GUO H G, LI W F, YAO F, et al. Who are more exposed to PM2.5 pollution: A mobile phone data approach[J]. Environment International, 2020(143): 105821. [15] WANG Z C, CHEN L R, DING Z N, et al. An enhanced interval PM2.5 concentration forecasting model based on BEMD and MLPI with influencing factors[J]. Atmospheric Environment, 2020(223): 117200. [16] ARIF M, PARVEEN S. Carcinogenic effects of indoor black carbon and particulate matters (PM2.5 and PM10) in rural households of India[J]. Environmental Science and Pollution Research, 2021, 28(2): 2082-2096. doi: 10.1007/s11356-020-10668-5 [17] 贺宇千, 王杰, 黄合来. 基于相对危险暴露量的驾驶人事故风险分析[J]. 交通信息与安全, 2019, 37(5): 40-45. doi: 10.3963/j.issn.1674-4861.2019.05.006HE Y Q, WANG J, HUANG H L. An analysis of crash risk of drivers based on quasi-induced exposure[J]. Journal of Transport Information and Safety, 2019, 37(5): 40-45. (in Chinese) doi: 10.3963/j.issn.1674-4861.2019.05.006 [18] UBOLSAKKA J C, TONGDEE P, JONES D A. The effects of slow loaded breathing training on exercise blood pressure in isolated systolic hypertension[J]. Physiotherapy Research International, 2019, 24(4): e1785. [19] 朱才华, 孙晓黎, 李岩. 站点分类下的城市公共自行车交通需求预测[J]. 吉林大学学报(工学版), 2021, 51(2): 531-540. https://www.cnki.com.cn/Article/CJFDTOTAL-JLGY202102017.htmZHU C H, SUN X L, LI Y. Forecast of urban public bicycle traffic demand by station classification[J]. Journal of Jilin University(Engineering and Technology Edition), 2021, 51 (2): 531-540. (in Chinese) https://www.cnki.com.cn/Article/CJFDTOTAL-JLGY202102017.htm [20] ZUURBIER M, HOEK G, OLDENWENING M, et al. Commuters'exposure to particulate matter air pollution is affected by mode of transport, fuel type, and route[J]. Environmental Health Perspectives, 2010, 118(6): 783-789. doi: 10.1289/ehp.0901622 [21] 陈艳, 李永波, 沈讷敏, 等. 口罩对大气PM2.5中主要污染物的阻隔效果研究[J]. 环境与健康杂志, 2019, 36(1): 34-37. https://www.cnki.com.cn/Article/CJFDTOTAL-HJYJ201901013.htmCHEN Y, LI Y B, SHEN N M, et al. Obstruction effect of masks to major pollutants in PM2.5[J]. Journal of Environment and Health, 2019, 36(1): 34-37. (in Chinese) https://www.cnki.com.cn/Article/CJFDTOTAL-HJYJ201901013.htm -

 点击查看大图
计量
- 文章访问数: 1113
- HTML全文浏览量: 560
- PDF下载量: 40
- 被引次数: 0