

A Time-to-collision Hybrid Distribution Model Considering Congestion Under a Vehicle-to-vehicle Communication Environment
-
摘要: 碰撞时间(TTC)是评价车车碰撞风险的有效指标,然而该指标分布规律受到交通状态影响。为研究车车(V2V)通信环境下不同交通状态的TTC分布规律,通过构建基于LTE-V技术的车车通信环境,开展实车实验获取4种典型城市道路中的驾驶数据。考虑加速度和航向角建立动态冲突辨识模型,计算车辆以任意角度接近时的TTC值;针对TTC值的结果出现多峰值现象,将交通流分为“拥堵、缓行、畅通”这3种状态,构建了考虑交通流状态的高斯混合模型以描述不同交通状态下的TTC分布规律,并采用最大期望(EM)算法进行参数求解。将所建高斯混合模型与负指数分布、对数正态分布、负指数/对数正态混合分布这3种传统的TTC分布模型进行对比,采用校正决定系数R2评价模型的拟合优度,并通过K-S检验验证模型的有效性。在此基础上,将所建高斯混合模型应用于非车车通信条件下不同交通状态的TTC分布拟合描述,进一步验证模型的适用性。结果表明:车车通信环境下“拥堵、缓行、畅通”这3种交通状态下的高斯分布均值逐渐增大,所处交通场景的碰撞风险依次降低;考虑交通状态的TTC高斯混合模型拟合优度为0.950 5,相较于其他TTC混合分布模型,拟合优度提升了0.057 5。Abstract: Time-to-collision(TTC)is an effective variable to evaluate the risk of vehicle collision, however it is highly correlated with traffic states. In order to study the TTC distributionat different traffic states under a vehicle-to-vehicle(V2V)communication environment, a test environment based on the long-term evolution-vehicle (LTE-V) technology is developed, and a field experiment is carried out to collect driving behavior data on four typical urban roads. A dynamic conflict identification model considering acceleration and heading angle of tested vehicles is developed to estimate the TTC when the vehicle approached at any angle. Since there are several peaks with- in the distribution of the TTC data, traffic flows are divided into the following three states: congested, slow, and free-flow. A Gaussian mixture model(GMM) considering traffic congestion state is developed to describe the TTC distribution under different traffic states, and an expectation-maximization (EM) algorithm is used to estimate the parameters of the GMM. Three traditional distribution models of TTC including negative exponential, lognormal, and negative exponential / lognormal mixed are compared with the GMM. The goodness of fit of the model is evaluated by adjusted R2, and the effectiveness of the model is verified by a K-S test. Then, the GMM is applied to the description of TTC distribution fitting under the condition of non V2V communication to further verify the applicability of the model. The results show that, the mean of Gaussian distribution for three traffic states of"congested, slow, and free-flow"gradually increases in the V2V communication environment, and the collision risk of each traffic scene decreases in turn. Moreover, the goodness of fit of the GMM is 0.950 5, which is 0.057 5 higher than the other mixed distribution models.
-

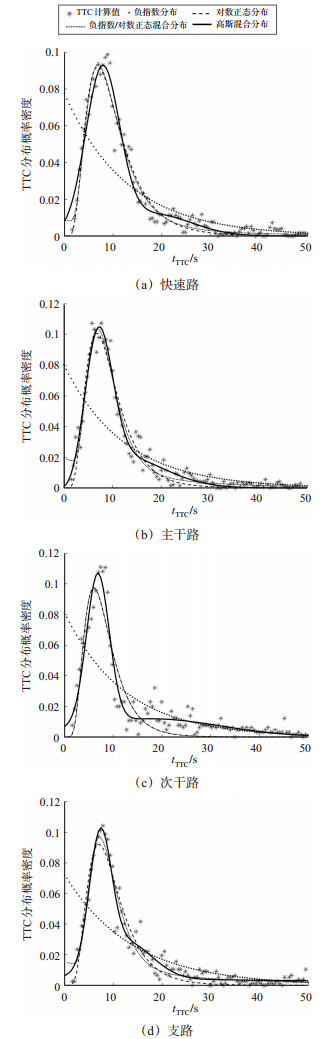
图 5 车车通信环境下4种等级道路的TTC分布拟合结果
Figure 5. TTC distributions fitting results of four grades of urban roads in V2V communication
表 1 实验组 & 对照组 & 背景车辆组的模型输入数据
Table 1. Input data of experimental group, control group, and background group
输入数据 数据含义 单位 ∆x 前车与后车的横向相对距离 m ∆y 前车与后车的纵向相对距离 m Vx1/Vx2 前车/后车的横向速度 m/s Vy1/Vy2 前车/后车的纵向速度 m/s ax1/ax2 前车/后车的横向加速度 m/s2 ay1/ay2 前车/后车的纵向加速度 m/s2 α1/α2 前车/后车航向角 (°) w1/ w2 前车/后车角速度 (°)/s  下载: 导出CSV
表 2 车车通信环境各等级道路TTC的数据量分布
Table 2. The number of TTC values of each grade road in V2V communication
道路等级 tTTC/s的数据量 (0, 50 s] (50, 100 s] (100, 150 s] (150, 200 s] (200, 250 s] (250, 300 s] (300, 400 s] (400, 500 s] (500, 600 s] (600, 700 s] 快速路 4 045 28 5 3 2 0 2 1 2 1 主干路 3 117 16 6 6 3 2 2 1 0 0 次干路 1 345 23 10 3 4 3 5 0 0 1 支路 1 641 12 15 1 0 1 3 2 0 0
下载: 导出CSV
表 3 车车通信环境各等级道路TTC计算结果
Table 3. TTC calculation results of each grade road in V2V communication
道路等级 原始数据量 有效tTTC 最小值/s 概率密度峰值/s 均值/s 标准差/s 快速路 8 756 4 045 1.625 8.879 12.774 8.104 主干路 5 462 3 117 1.537 8.514 12.192 7.655 次干路 3 849 1 345 1.156 8.468 11.791 10.225 支路 4 327 1 641 1.228 8.285 11.455 8.683
下载: 导出CSV
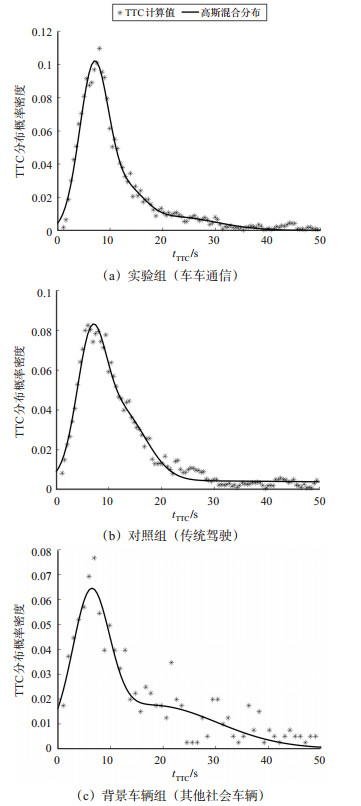
表 4 实验组 & 对照组 & 背景车辆组TTC计算结果
Table 4. TTC calculation results of experimental group, control group, and background group
分组情况 原始数据量 有效tTTC 最小值/s 概率密度峰值/s 均值/s 标准差/s 实验组 20 927 9 906 1.156 8.012 11.402 8.102 对照组 20 668 9 938 1.735 7.362 13.235 8.948 背景车辆组 1 020 413 1.071 7.528 14.352 11.654
下载: 导出CSV
表 5 车车通信环境各等级道路TTC拟合参数结果
Table 5. TTC fitting parameters of different levels' roads in V2V communication
模型 参数 快速路 主干路 次干路 支路 负指数分布 λ 0.077 8 0.081 0 0.083 7 0.078 9 adj.R2 0.346 0 0.283 9 0.325 4 0.240 5 μ 2.213 0 2.167 4 2.041 2 2.121 0 对数正态分布 σ 0.544 6 0.513 2 0.616 2 0.567 6 adj.R2 0.850 9 0.833 2 0.827 0 0.824 8 w 0.182 0 0.314 2 0.468 4 0.218 0 负指数/对数 λ' 0.047 5 0.061 7 0.055 9 0.038 2 正态 μ' 2.170 5 2.102 3 1.895 1 2.051 9 混合分布 σ' 0.480 5 0.394 9 0.332 8 0.482 1 adj.R2 0.887 2 0.900 3 0.889 1 0.893 0 w1 0.512 2 0.535 1 0.583 8 0.603 3 w2 0.306 6 0.350 9 0.292 0 0.280 6 w3 0.181 2 0.114 0 0.124 2 0.116 1 μ1 8.240 2 7.974 3 7.113 3 6.982 0 高斯混合分布 μ2 14.194 6 15.690 6 15.124 8 13.977 5 μ3 24.755 6 26.953 9 23.369 8 29.704 6 σ1 4.434 9 6.036 6 5.403 2 5.339 0 σ2 10.401 1 17.762 2 23.810 9 21.992 4 σ3 89.776 0 77.872 4 68.359 6 115.072 5 adj.R2 0.937 2 0.935 9 0.917 0 0.950 5
下载: 导出CSV
表 6 种模型K-S检验结果
Table 6. K-S test results of the four models
道路等级 样本量 p-value 负指数分布 对数正态分布 负指数/ 对数正态混合分布 高斯混合分布 快速路 4 045 7.584×10⁻³/不通过 0.086 4/通过 0.108 3/通过 0.162 1/通过 主干路 3 117 6.305×10⁻³/不通过 0.109 7/通过 0.135 8/通过 0.173 9/通过 次干路 1 345 9.016×10⁻⁵/不通过 0.125 6/通过 0.136 5/通过 0.328 5/通过 支路 1 641 4.792×10⁻⁴/不通过 0.073 1/通过 0.096 5/通过 0.142 8/通过
下载: 导出CSV
表 7 实验组 & 对照组 & 背景车辆组GMM参数及K-S检验结果
Table 7. Results of GMM fitting parameters and K-S test of experimental group, control group, and background group
参数 实验组 对照组 背景车辆组 w1 0.580 7 0.413 7 0.459 0 w2 0.275 8 0.407 3 0.333 0 w3 0.143 5 0.179 0 0.208 0 μ1 7.084 5 7.567 1 7.715 8 μ2 12.814 8 13.057 8 15.624 8 μ3 26.154 8 27.429 2 34.234 2 σ1 5.724 9 5.274 7 7.582 5 σ2 17.806 8 17.106 7 29.910 1 σ3 103.178 8 112.246 3 121.185 6 样本量 9 906 9 938 413 adj.R2 0.923 7 0.940 3 0.759 4 p-value 0.215 7 0.346 0 0.073 1 检验结果 通过 通过 通过
下载: 导出CSV
-
[1] HAYWARD J C. Near-miss determination through use of a scale of danger[R]. Washington, D. C. : Highway Research Board, 1972. [2] VOGEL K. A comparison of headway and time to collision as safety indicators[J]. Accident Analysis & Prevention, 2003, 35(3): 427-433. [3] MILANES V, PEREZ J, GODOY J, et al. A fuzzy aid rear-end collision warning/avoidance system[J]. Expert Systems with Applications, 2012, 39(10): 9097-9107. doi: 10.1016/j.eswa.2012.02.054 [4] NADIMI N, RAGLAND D R, AMIRI A M, et al. An evaluation of time-to-collision as a surrogate safety measure and a proposal of a new method for its application in safety analysis[J]. Transportation Letters-The International Journal of Transportation Research, 2020, 12(7): 491-500. [5] 吴子祥, 黄合来, 陈吉光, 等. 视线遮挡条件下面向弱势道路使用者的避撞策略研究[J]. 交通信息与安全, 2021, 39(4): 9-15+34. https://www.cnki.com.cn/Article/CJFDTOTAL-JTJS202104003.htmWU Z X, HUANG H L, CHEN J G, et al. A study on collision avoidance strategy for vulnerable road users under visual obstruction[J]. Journal of Transport Information and Safety, 2021, 39(4): 9-15+34. (in Chinese) https://www.cnki.com.cn/Article/CJFDTOTAL-JTJS202104003.htm [6] SAFFARZADEH M, NADIMI N, NASERALAVI S, et al. A general formulation for time-to-collision safety indicator[J]. Proceedings of the Institution of Civil Engineers-Transport, 2013, 166(5): 294-304. doi: 10.1680/tran.11.00031 [7] HUANG C M, LIN S Y. An advanced vehicle collision warning algorithm over the DSRC communication environment: an advanced vehicle collision warning algorithm[C]. IEEE 27th International Conference on Advanced Information Networking and Applications(IEEE AINA), Barcelona, Spain: IEEE Computer Society, 2013. [8] 刘庆华, 邱修林, 谢礼猛, 等. 基于行驶车速的车辆防撞时间预警算法[J]. 农业工程学报, 2017, 33(12): 99-106. https://www.cnki.com.cn/Article/CJFDTOTAL-NYGU201712013.htmLIU Q H, QIU X L, XIE L M, et al. Early warning algorithm of vehicle anti-collision time based on driving speed[J]. Transactions of the Chinese Society of Agricultural Engineering, 2017, 33(12): 99-106. (in Chinese) https://www.cnki.com.cn/Article/CJFDTOTAL-NYGU201712013.htm [9] ZHAO X M, JING S C, HUI F, et al. DSRC-based rear-end collision warning system-an error-component safety distance model and field test[J]. Transportation Research Part C: Emerging Technologies, 2019, 107(10): 92-104. [10] 石建军, 汪旭, 付玉. 基于车联网的车辆纵向碰撞分级预警研究[J]. 重庆交通大学学报(自然科学版), 2020, 39(9): 1-7. https://www.cnki.com.cn/Article/CJFDTOTAL-CQJT202009001.htmSHI J J, WANG X, FU Y. Hierarchical early warning of vehicle longitudinal collision based on internet of vehicles[J]. Journal of Chongqing Jiaotong University(Natural Science), 2020, 39(9): 1-7. (in Chinese) https://www.cnki.com.cn/Article/CJFDTOTAL-CQJT202009001.htm [11] 迟仲达. 基于车路协同技术的车辆防碰撞预警系统开发[D]. 长春: 吉林大学, 2012.CHI Z D. Development of vehicle collision warning system based on intelligent vehicle infrastructure cooperative technology[D]. Changchun: Jilin University, 2012. (in Chinese) [12] SENGUPTA R, REZAEI S, SHLADOVER S E, et al. Cooperative collision warning systems: Concept definition and experimental implementation[J]. Journal of Intelligent Transportation Systems, 2007, 11(3): 143-155. doi: 10.1080/15472450701410452 [13] 赵晓翠, 杨峰, 邓宝. 高速公路互通立交分流区车头时距分布[J]. 公路交通科技, 2012, 29(2): 136-139. https://www.cnki.com.cn/Article/CJFDTOTAL-GLJK201202025.htmZHAO X C, YANG F, DENG B. Headway distribution characteristics of diverging area on expressway interchanges[J]. Journal of Highway and Transportation Research and Development, 2012, 29(2): 136-139. (in Chinese) https://www.cnki.com.cn/Article/CJFDTOTAL-GLJK201202025.htm [14] 王畅, 付锐, 张琼, 等. 换道预警系统中参数TTC特性研究[J]. 中国公路学报, 2015, 28(8): 91-100+108. https://www.cnki.com.cn/Article/CJFDTOTAL-ZGGL201508013.htmWANG C, FU R, ZHANG Q, et al. Research on parameter TTC characteristics of lane change warning system[J]. China Journal of Highway and Transport, 2015, 28(8): 91-100+108. (in Chinese) https://www.cnki.com.cn/Article/CJFDTOTAL-ZGGL201508013.htm [15] 王颖, 方志纯, 简注清, 等. 车辆荷载特性影响下的碰撞时间分布规律[J]. 交通运输系统工程与信息, 2020, 20(5): 240-246. https://www.cnki.com.cn/Article/CJFDTOTAL-YSXT202005035.htmWANG Y, FANG Z C, JIAN Z Q, et al. Effect of vehicle load characteristics on distributions of time-to-collision[J]. Journal of Transportation Systems Engineering and Information Technology, 2020, 20(5): 240-246. (in Chinese) https://www.cnki.com.cn/Article/CJFDTOTAL-YSXT202005035.htm [16] 王江锋, 熊慧媛, 徐亮, 等. 考虑风险等级的车车通信MTTC混合分布模型[J]. 哈尔滨工业大学学报, 2021, 53(9): 53-61. https://www.cnki.com.cn/Article/CJFDTOTAL-HEBX202109007.htmWANG J F, XIONG H Y, XU L, et al. Mixed distribution model of modified time-to-collision considering risk levels in vehicle-to-vehicle communication[J]. Journal of Harbin Institute of Technology, 2021, 53(9): 53-61. (in Chinese) https://www.cnki.com.cn/Article/CJFDTOTAL-HEBX202109007.htm [17] GAN X F, WENG J X, LUO J B. Finite mixture distribution method to model vehicle headways at port collector-distributor roads[J]. Journal of Transportation Engineering, Part A: Systems, 2021, 147(12): 04021084. [18] 王福建, 戴美伟, 孙凌涛, 等. 基于多类跟驰行为的车头时距混合分布模型[J]. 浙江大学学报(工学版), 2015, 49(7): 1288-1294. https://www.cnki.com.cn/Article/CJFDTOTAL-ZDZC201507013.htmWANG F J, DAI M W, SUN L T, et al. Mixed distribution model of vehicle headway based on multiclass car following[J]. Journal of Zhejiang University(Engineering Science), 2015, 49(7): 1288-1294. (in Chinese) https://www.cnki.com.cn/Article/CJFDTOTAL-ZDZC201507013.htm [19] 崔会芬, 楚彭子, 杨京帅, 等. 城市平面交叉口交通冲突影响因素分析[J]. 武汉理工大学学报(交通科学与工程版), 2017, 41(5): 762-765. https://www.cnki.com.cn/Article/CJFDTOTAL-JTKJ201705010.htmCUI H F, CHU P Z, YANG J S, et al. Analysis on influencing factors of traffic conflict at urban grade intersection[J]. Journal of Wuhan University of Technology(Transportation Science & Engineering), 2017, 41(5): 762-765. (in Chinese) https://www.cnki.com.cn/Article/CJFDTOTAL-JTKJ201705010.htm [20] 唐敏, 王东强, 曾鑫钰. 汽车碰撞预警主动安全预测方法[J]. 计算机科学, 2020, 47(4): 318-322. https://www.cnki.com.cn/Article/CJFDTOTAL-JSJA202004049.htmTANG M, WANG D Q, ZENG X Y. Active safety prediction method for automobile collision warning[J]. Computer Science, 2020, 47(4): 318-322. (in Chinese) https://www.cnki.com.cn/Article/CJFDTOTAL-JSJA202004049.htm [21] GOKGOZ T, HACAR M, MEMDUHOGLU A, et al. An experimental study on map projection transformation using GIS tools[J]. Sigma Journal of Engineering and Natural Sciences-Sigma Muhendislik ve Fen Bilimleri Dergisi, 2017, 35(1): 101-117. [22] 马瑄. 基于改进DBSCAN算法和K-S检验的收视数据集异常检测方法[D]. 北京: 北京邮电大学, 2021.MA X. Anomaly detection method based on improved DBSCAN algorithm and K-S test[D]. Beijing: Beijing University of Posts and Telecommunications, 2021. (in Chinese) [23] 蒋硕然, 陈亚瑞, 秦智飞, 等. 基于KS检验的高斯混合模型分裂与合并算法[J]. 中国科学技术大学学报, 2018, 48(6): 477-485. https://www.cnki.com.cn/Article/CJFDTOTAL-ZKJD201806006.htmJIANG S R, CHEN Y R, QIN Z F, et al. Split and merge algorithm for Gaussian mixture model based on KS test[J]. Journal of University of Science and Technology of China, 2018, 48(6): 477-485. (in Chinese) https://www.cnki.com.cn/Article/CJFDTOTAL-ZKJD201806006.htm -


 点击查看大图
计量
- 文章访问数: 1531
- HTML全文浏览量: 748
- PDF下载量: 77
- 被引次数: 0