

An Analysis of Severity and Heterogeneity of Pedestrian Traffic Accidents Under Low Visibility Environment
-
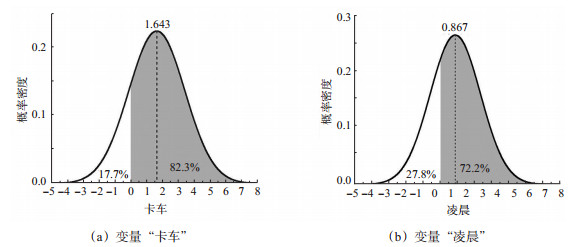
摘要: 为探究在低能见度水平下影响行人事故伤害严重程度的因素, 并分析可能存在的异质性。以某市6 405起行人-机动车交通事故为研究对象, 分别研究高、低能见度水平下机动车-行人事故中行人伤害严重程度影响因素, 建立均值异质性的随机参数Logit模型并通过弹性分析定量分析显著变量对行人受伤情况的影响程度。结果表明, 高、低能见度下影响行人伤害严重程度的因素存在明显差异。(1)低能见度情况下男性驾驶员、高龄行人、卡车、沥青路面、凌晨、较暗的照明条件等因素会增加行人伤害严重程度。(2)低能见度情况下卡车和凌晨这2个因素具有随机参数特征, 分别使行人死亡的概率增加了4.39%和2.67%;此外, 当事故涉及卡车和26~35岁行人这2个因素时会增大行人死亡的概率; 而当夜间有路灯照明与凌晨这2个因素共同作用时行人死亡的可能性降低。(3)高能见度情况下未发现具有异质性的影响因素, 但发现男性行人和摩托车等因素会增大事故严重程度; 而驾驶员年龄、沥青路面、周末和地形等因素对事故严重程度并没有显著影响。Abstract: This work studies the factors affecting the severity of pedestrian accidents under low visibility levels and investigates the possible heterogeneity. Taking 6 405 motor vehicle-pedestrian accidents in a city as the object, a random parameter Logit model with heterogeneity in means is established to investigate the factors influencing the severity of pedestrian injuries under high and low visibility levels. Elasticity analysis is used to quantify the influences of significant variables on pedestrian injuries. The results show that there are significant differences in the factors affecting severity of the pedestrian injury under high and low visibility.(1) Male drivers, elderly pedestrians, trucks, asphalt roads, early morning hours, and dark lighting conditions increase the severity of pedestrian injuries under low visibility.(2) Trucks and early morning hours have random parameters under low visibility, which increases the probability of pedestrian death by 4.39% and 2.67%, respectively. Besides, accidents involving trucks and pedestrians at the age from 26 to 35 will increase pedestrian fatalities, and its probability decreases as the combination of street lighting and early morning hours.(3) No heterogeneous factors are found under high-visibility conditions; however, factors such as male pedestrians and motorcycles are found to increase the severity of the accidents. Additionally, factors such as the age of the driver, asphalt road, weekend, and terrain have no significant impact on the severity of the accident.
-

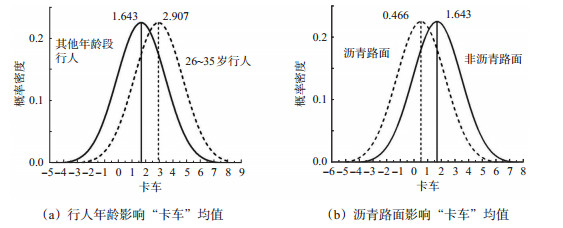
图 2 “卡车”均值异质性参数分布
Figure 2. Distribution of random parameters with heterogeneity in means for"truck"

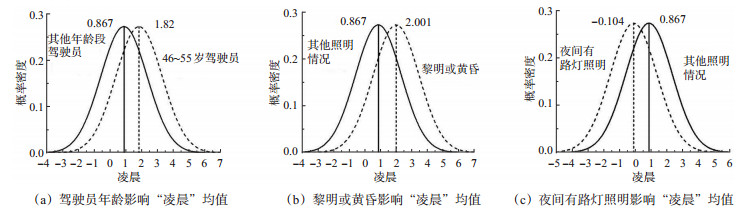
图 3 “凌晨”均值异质性参数分布
Figure 3. Distribution of random parameters with heterogeneity in means for"early morning hours"
表 1 变量的描述性统计
Table 1. Descriptive statistics of variables
变量 分类 低能见度 高能见度 总体 事故数 占比/% 事故数 占比/% 事故数 占比/% 驾驶员性别 女* 253 7.56 293 9.58 546 8.52 男 3 094 92.44 2 765 90.42 5 859 91.48 驾驶员年龄/岁 ≤25* 611 18.26 514 16.81 1 125 17.56 26~35 1 299 38.81 1 222 39.96 2 521 39.36 36~45 958 28.62 903 29.53 1 861 29.06 46~55 409 12.22 357 11.67 766 11.96 > 55 70 2.09 62 2.03 132 2.06 行人性别 女* 1 353 40.42 1 384 45.26 2 737 42.73 男 1 994 59.88 1 674 54.74 3 668 57.27 行人年龄/岁 ≤25* 587 17.54 604 19.75 1 191 18.59 26~35 393 11.74 332 10.86 725 11.32 36~45 397 11.86 352 11.51 749 11.69 46~55 606 18.11 480 15.70 1 086 16.96 > 55 1 364 10.75 1 290 42.18 2 654 41.44 车辆类型 轿车* 2 343 70.00 2 256 73.77 4 599 71.80 厢式货车 344 10.28 279 9.12 623 9.73 卡车 360 10.76 246 8.04 606 9.46 客车 211 6.30 229 7.49 440 6.87 摩托车 89 2.66 48 1.57 137 2.14 机动车运行状态 直行* 2 859 85.42 2 498 81.69 5 357 83.64 左转 137 4.09 152 4.97 289 4.51 右转 76 2.27 86 2.81 162 2.53 掉头 39 1.17 38 1.24 77 1.20 倒车 236 7.05 284 9.29 520 8.12 路面状况 路面破损* 104 3.11 70 2.29 174 2.72 路面完好 3 243 96.89 2 988 97.71 6 231 97.28 路面结构 非沥青路面* 371 11.08 395 12.92 766 11.96 沥青路面 2 976 88.92 2 663 87.08 5 639 88.04 道路等级 一般城市道路* 2 230 66.63 2 334 76.32 4 565 71.26 等级公路 985 29.43 571 18.67 1 556 24.29 其他道路 132 3.94 153 5.00 285 4.45 地区 农村* 1 621 48.43 1 035 33.85 2 656 41.47 城市 1 726 51.57 2 023 66.15 3 749 58.053 时间/周 工作日* 2 435 72.75 2 250 73.58 4 685 73.15 周末 912 27.25 808 26.42 1 720 26.85 其他时间* 1 801 53.81 1 912 62.52 3 713 57.97 时间/d 凌晨 490 14.64 236 7.72 726 11.33 早高峰 277 8.28 413 13.51 690 10.77 晚高峰 779 23.27 497 16.25 1 276 19.92 地形 平原* 3 232 96.56 3 016 98.63 6 248 97.55 丘陵 54 1.61 11 0.36 65 1.01 山区 61 1.82 31 1.01 92 1.44 照明情况 白天* 1 436 42.90 2 252 73.64 3 688 57.58 夜间有路灯照明 1 118 33.40 618 20.21 1 736 27.10 夜间无路灯照明 695 20.76 141 4.61 836 13.05 黎明或黄昏 98 2.93 47 1.54 145 2.26 注: *表示参照类别。  下载: 导出CSV
表 2 参数估计结果
Table 2. Results of parameter estimation
变量名称 低能见度 高能见度 重伤事故 死亡事故 重伤事故 死亡事故 常数项 -1.690(-5.01) -2.468(-8.26) -3.989(-11.80) -3.076(-12.87) 随机参数 卡车 1.071(5.58) 1.643(7.29) 1.506(7.51) 2.059(11.98) 参数分布标准差 — 1.773(2.40) — — 凌晨 0.345(2.12) 0.867(4.79) — 0.993(6.05) 参数分布标准差 — 1.469(2.62) — — 均值异质性 卡车:行人年龄在26~35岁 — 1.264(2.11) — — 卡车:沥青路面 — -1.177(-11.80) — — 凌晨:驾驶员年龄在46~55岁 — 0.953(1.94) — — 凌晨:夜间有路灯照明 — -0.971(-1.98) — — 凌晨:黎明或黄昏 — 1.134(1.71) — — 驾驶员特征 男性驾驶员 — 0.594(2.88) 0.687(3.04) 0.622(2.73) 驾驶员年龄在26~35岁 — -0.217(-1.71) — — 驾驶员年龄在36~45岁 — -0.304(-2.21) — — 驾驶员年龄在46~55岁 — -0.427(-2.48) — — 驾驶员年龄在56岁及以上 — -0.610(-1.80) — — 行人特征 男性行人 — — — 0.442(4.21) 行人年龄在26~35岁 — 0.321(1.72) — — 行人年龄在46~55岁 — 0.522(3.71) — — 行人年龄在56岁及以上 0.381(3.28) 1.081(8.99) — 0.576(5.54) 车辆特征 厢式货车 0.451(2.41) 0.833(5.67) 0.867(5.01) 0.902(5.57) 客车 0.491(2.26) 0.677(3.47) 0.793(4.25) 0.749(4.03) 摩托车 — — 1.106(3.30) — 车辆左转 -1.401(-3.51) -1.271(-4.05) -1.319(3.53) -0.645(-2.34) 车辆右转 -1.636(-2.72) -0.956(-2.43) -0.703(-1.83) — 车辆掉头 — -1.748(-2.28) — — 车辆倒车 -0.673(-2.59) — -1.213(-1.65) — 道路特征 路面完好 -0.709(-2.59) — — — 沥青路面 0.361(1.85) 0.303(1.99) 0.779(3.77) — 等级公路 — 0.453(3.32) 0.733(3.16) 0.630(4.97) 其他道路 1.181(4.58) 1.187(4.82) 1.093(4.35) 0.792(3.68) 环境特征 城市地区 — -0.721(-5.67) 0.932(4.82) — 周末 — 0.202(1.98) — — 晚高峰 -0.267(-1.90) -0.312(-2.62) — -0.490(-3.07) 丘陵 — 1.486(3.94) — — 山区 0.835(2.62) — — — 夜间有路灯照明 0.616(4.73) 0.429(3.51) 0.525(4.15) 0.518(3.62) 夜间无路灯照明 0.698(4.29) 1.126(8.34) — 0.870(4.06) 黎明或黄昏 — 0.684(2.32) -1.961(-1.93) — 模型检验 AIC 5 602.2 4 792.7 对数似然初始值 -3 188.411 3 -2 649.050 8 对数似然收敛值 -2 755.085 9 -2 367.348 6 McFadden Pseudo R2 0.250 7 0.295 3 注:括号中的数值为该变量的z检验统计量;“—”表示不适用。
下载: 导出CSV
表 3 弹性分析结果
Table 3. Results of elasticity analysis
显著变量 无伤或轻伤 重伤 死亡 随机参数 卡车 -0.057 5 0.013 6 0.043 9 凌晨 -0.032 7 0.006 0 0.026 7 非随机参数 男性驾驶员 -0.086 5 -0.020 3 0.106 7 驾驶员年龄 0.013 1 0.003 1 -0.016 2 在26~35岁 驾驶员年龄 0.0137 0.003 2 -0.016 9 在36~45岁 驾驶员年龄 0.008 2 0.001 9 -0.010 1 在46~55岁 驾驶员年龄 0.002 0 0.000 5 -0.002 5 在56岁及以上 行人年龄 -0.005 8 -0.001 4 0.007 2 在26~35岁 行人年龄 -0.015 4 -0.003 6 0.019 0 在46~55岁 行人年龄 -0.106 1 0.018 4 0.087 7 在56岁及以上 厢式货车 -0.022 4 0.005 5 0.016 9 客车 -0.012 0.003 6 0.008 4 车辆左转 0.017 -0.006 8 -0.010 2 车辆右转 0.008 6 -0.004 4 -0.004 2 车辆掉头 0.003 4 0.000 8 -0.004 2 车辆倒车 0.003 8 -0.005 6 0.001 8 路面完好 0.055 7 -0.082 0 0.026 3 沥青路面 -0.091 2 0.037 5 0.053 7 等级公路 -0.021 6 -0.005 1 0.026 6 其他道路 -0.014 6 0.005 5 0.009 4 城市地区 0.059 5 0.014 0 -0.073 4 周末 -0.008 8 -0.002 1 0.010 8 晚高峰 0.021 7 -0.007 3 -0.014 4 丘陵 -0.003 8 -0.000 9 0.004 7 山区 -0.001 2 0.001 8 -0.000 6 夜间有路灯照明 -0.052 1 0.024 3 0.027 8 夜间无路灯照明 -0.063 4 0.017 0 0.046 4 黎明或黄昏 -0.003 2 -0.000 7 0.003 9
下载: 导出CSV
-
[1] World Health Organization. Global status report on road safety 2018[M]. Switzerland: World Health Organization, 2018. [2] 国家统计局. 中国统计年鉴[M]. 北京: 中国统计出版社, 2019.National Bureau of Statistics. China Statistical Yearbook[M]. Beijing: China Statistics Press, 2019. (in Chinese). [3] MOUDON A V, LIN Lin, JIAO Junfeng, et al. The risk of pedestrian injury and fatality in collisions with motor vehicles, a social ecological study of state routes and city streets in King County, Washington[J]. Accident Analysis & Prevention, 2011, 43(1): 11-24. http://www.onacademic.com/detail/journal_1000034578049510_0407.html [4] National Highway Safety Administration. Traffic safety facts: 2016 data overview[M]. Washington, D. C. : National Highway Safety Administration, 2018. [5] World Health Organization. The world health report 2013[M]. Switzerland: World Health Organization, 2013. [6] AZIZ H M A, UKKUSURI S V, HASAN S. Exploring the determinants of pedestrian-vehicle crash severity in New York City[J]. Accident Analysis & Prevention, 2013(50): 1298-1309. http://www.sciencedirect.com/science/article/pii/S0739885912002065 [7] HALEEM K, ALLURI P, GAN A. Analyzing pedestrian crash injury severity at signalized and non-signalized locations[J]. Accident Analysis & Prevention, 2015(81): 14-23. [8] LI Zhenning, CHEN Cong, WU Qiong, et al. Exploring driver injury severity patterns and causes in low visibility related single-vehicle crashes using a finite mixture random parameters model[J]. Analytic Methods in Accident Research, 2018(20): 1-14. http://www.onacademic.com/detail/journal_1000040414107310_0363.html [9] 王涛, 黎文皓, 李文勇. 电动自行车交通事故严重程度影响因素分析[J]. 广西大学学报(自然科学版), 2017, 42(6): 2080-2088. https://www.cnki.com.cn/Article/CJFDTOTAL-GXKZ201706013.htmWANG Tao, LI Wenhao, LI Wenyong. Influence factors and injury severity in electric bicycles traffic crashes[J]. Journal Of Guangxi University: (Natural Science Edition), 2017, 42(6): 2080-2088. (in Chinese). https://www.cnki.com.cn/Article/CJFDTOTAL-GXKZ201706013.htm [10] REZAPOUR M, Moomen M, Ksaibati K. Ordered logistic models of influencing factors on crash injury severity of single and multiple-vehicle downgrade crashes: A case study in Wyoming[J]. Journal of Safety Research, 2019, 4(68): 107-118. http://www.ncbi.nlm.nih.gov/pubmed/30876502 [11] KIM J K, UIFARSSON G F, SHANKAR V N, et al. A note on modeling pedestrianinjury severity in motor-vehicle crashes with the mixed logit model[J]. Accident Analysis & Prevention, 2010, 42(6): 1751-1758. http://www.sciencedirect.com/science?_ob=ShoppingCartURL&_method=add&_eid=1-s2.0-S0001457510001326&originContentFamily=serial&_origin=article&_ts=1475414046&md5=f52196c46c1700f00e62fe9b5e062a00 [12] WU Qiong, CHEN Feng, ZHANG Guohui, et al. Mixed logit model-based driver injury severity investigations in singleand multi-vehicle crashes on rural two-lane high-ways[J]. Accident Analysis & Prevention, 2014(72): 105-115. [13] 陈昭明, 徐文远, 曲悠扬, 等. 基于混合Logit模型的高速公路交通事故严重程度分析[J]. 交通信息与安全, 2019, 37(3): 42-50. doi: 10.3963/j.issn.1674-4861.2019.03.006CHEN Zhaoming, XU Wenyuan, QU Youyang, et al. Severity of traffic crashes on freeways based on mixed logit model[J]. Journal of Transport Information and Safety, 2019, 37(3): 42-50. (in Chinese). doi: 10.3963/j.issn.1674-4861.2019.03.006 [14] HOU Qinzhong, HUO Xiaoyan, LENG Junqiang, et al. Examination of driver injury severity in freeway single-vehicle crashes using a mixed logit model with heterogeneity-in-means[J]. Physica A: Statistical Mechanics and its Applications, 2019(531): 121760. http://www.sciencedirect.com/science/article/pii/S0378437119310088 [15] MANNERING F L, SHANKAR V, BHAT C R. Unobserved heterogeneity and the statistical analysis of highway accident data[J]. Analytic Methods in Accident Research, 2016(11): 1-16. http://www.researchgate.net/profile/Fred_Mannering/publication/301674152_Unobserved_heterogeneity_and_the_statistical_analysis_of_highway_accident_data/links/5720e8d108aed056fa292bc5.pdf [16] SERANEEPRAKARN P, HUANG Shuaiqi, SHANKAR V, et al. Occupant injury severities in hybrid-vehicle involved crashes: A random parameters approach with heter-ogeneity in means and variances[J]. Analytic Methods in Accident Research, 2017(15): 41-55. http://www.onacademic.com/detail/journal_1000039947331010_283c.html [17] 中华人民共和国国家质量监督检验检疫总局. 水平能见度等级: GB/T 33673—2017[S]. 北京: 中国标准出版社, 2017.General Administration of Quality Supervision, Inspection and Quarantine of the People's Republic of China. Grade of horizontal visibility: GB/T 33673—2017[S]. Beijing: Standards Press of China, 2017. (in Chine-se). [18] BEHNOOD A, MANNERING F L. The effect of passengers on driver-injury severities in single-vehicle crashes: A random parameters heterogeneity-in-means approach[J]. Analytic Methods in Accident Research, 2017(14): 41-53. http://www.onacademic.com/detail/journal_1000039932073810_2453.html [19] MILTON J C, SHANKAR V N, MANNERING F L. Highway accident severities and the mixed logit model: An exploratory empirical analysis[J]. Accident Analysis & Prevention, 2008, 40(1): 260-266. [20] LIU Jun, HAINEN A, LI Xiaobing, et al. Pedestrian injury severity in motor vehicle crashes: An integrated spatio-temporal modeling approach[J]. Accident Analysis & Prevention, 2019(132): 105272. http://d.wanfangdata.com.cn/periodical/ea7ffaf6b3f202b5ec2b56c2de4852cc [21] DUDDU V R, PENMETSA P, PULUGURTHA S S. Modeling and comparing injury severity of at-fault and not at-fault drivers in crashes[J]. Accident Analysis & Prevention, 2018(120): 55-63. [22] CHEN Zhen, FAN Wei. A multinomial logit model of pedestrian-vehicle crash severity in North Carolina[J]. International Journal of Transportation Science and Technology, 2019, 8(1): 43-52. doi: 10.1016/j.ijtst.2018.10.001 -

 点击查看大图
计量
- 文章访问数: 1452
- HTML全文浏览量: 766
- PDF下载量: 94
- 被引次数: 0