

Demand Forecasting of Taxi Travel Based on GPS Data
-
摘要:
近年来“网约车”数量越来越多,“网约车”等待时间长与载客热区需求大等问题也逐步显现,乘车体验亟需改善。在成都市出租车GPS数据的基础上,研究出租车出行分布规律,划分工作日为早、晚、夜高峰相关时段,引入k-距离曲线改进DBSCAN空间聚类算法,对出租车上下客点进行聚类分析,并用数据挖掘得出载客热区。采用BP神经网络预测载客热区的出行需求,预测结果表明,早高峰时段BP神经网络模型的MAPE分别较随机森林模型、岭回归模型提高了3.25%和5.87%,晚高峰时段提高了2.98%和4.32%、夜高峰时段提高了1.44%和2.58%,验证了BP神经网络在出租车需求预测方面的可行性。
Abstract:In recent years, the number of "car-hailing" keeps increasing, which leads to several problems gradually, such as long waiting time of "car-hailing"and large demands for hot spot areas. The experiences of "car-hailing" should be improved urgently. Based on GPS data of taxis in Chengdu, the distribution characteristics of taxi trips are studied by dividing working days into morning, evening, and night peak periods. A k-distance curve is used to improve the density-based spatial clustering of applications with noise(DBSCAN)algorithm. Cluster analysis is carried out on taxi pick-up and drop-down points, and the hot spot areas are obtained by data mining. The BP neural network is used to predict the travel demands in hot spot areas. The prediction results show that compared with the random forest model and ridge regression model, the MAPE of the BP neural network model increases by 3.25% and 5.87% in the morning peak, 2.98% and 4.32% in the evening peak, and 1.44% and 2.58% in the night peak, respectively, which verifies the feasibility of the BP neural network in demand forecasting of taxi travel.
-
Key words:
- urban traffic /
- hot spot areas /
- DBSCAN clustering /
- travel demand forecast /
- GPS
-

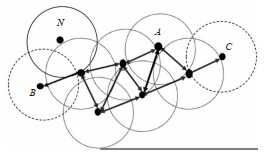
图 4 核心点、边界点、噪声点示意图
Figure 4. Schematic diagram of core points, boundary points and noise points

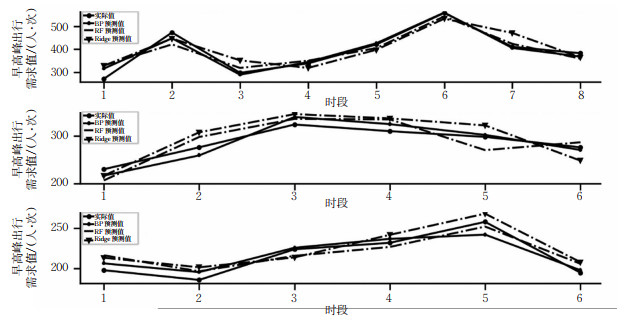
图 11 BP神经网络短期需求预测结果比较
Figure 11. Comparison of short-term demand-predicting results of the BP neural network
表 1 GPS轨迹数据字段及含义
Table 1. Data fields and meanings of the GPS track
序号 字段 含义 1 轨迹ID 编号 2 订单ID 编号 3 GPS Longitude 经度 4 GPS Latitude 纬度 5 GPS Time 采样时刻  下载: 导出CSV
表 2 2016年11月2日早高峰载客热点区域
Table 2. Attractive areas of passengers during the morning peak on November 2, 2016
载客热区ID 上下车乘客数量 质心经度/(°) 质心纬度/(°) 实际位置 Cluster0 359 104.054 584 4 30.674 606 8 川裕大厦 Cluster1 317 104.121 853 2 30.671 972 9 南苑社区 Cluster2 286 104.085 436 1 30.659 079 1 春熙路 Cluster3 401 104.115 458 1 30.684 269 2 电子科大(沙河校区) Cluster4 295 104.078 109 4 30.671 317 9 富力广场 Cluster5 312 104.045 616 3 30.681 223 2 西安路街道 Cluster6 456 104.079 335 0 30.703 397 0 成都站
下载: 导出CSV
表 3 2016年11月2日晚高峰载客热点区域
Table 3. Attractive areas of passengers during the evening peak on November 2, 2016
载客热区ID 上下车乘客数量 质心经度/(°) 质心纬度/(°) 实际位置 Cluster0 462 104.071 937 0 30.663 229 1 天府广场 Cluster1 429 104.079 335 0 30.703 397 0 成都站 Cluster2 381 104.102 541 1 30.667 970 1 猛追湾街 Cluster3 268 104.045 616 3 30.681 223 2 西安路街 Cluster4 287 104.068 841 4 30.710 629 3 华凌尚城社区 Cluster5 319 104.082 120 1 30.684 223 1 成中药附属眼科医院 Cluster6 212 104.035 762 1 30.666 819 1 杜甫草堂景区 Cluster7 376 104.076 208 1 30.652 683 2 滨江中路
下载: 导出CSV
表 4 2016年11月2日夜高峰载客热点区域
Table 4. Attractive areas of passengers during the night peak on November 2, 2016
载客热区ID 上下车乘客数量 质心经度/(。) 质心纬度/(°) 实际位置 Cluster0 395 104.076 208 1 30.652 683 2 锦兴路 Cluster1 311 104.102 541 1 30.667 970 1 猛追湾街 Cluster2 376 104.079 335 0 30.703 397 0 成都站 Cluster3 262 104.054 584 4 30.674 606 8 川裕大厦 Cluster4 287 104.071 710 1 30.608 824 3 盛和路 Cluster5 273 104.068 779 1 30.709 361 0 五福花园社区 Cluster6 347 104.078 109 4 30.671 317 9 富力广场
下载: 导出CSV
表 5 同一工作日当前时段与临近时段出行需求相关性分析
Table 5. Correlation of travel demands in the current working time and the adjacent time on the same working day
相关系数 Q(n, m) Q(n, m - 1) Q(n, m - 2) Q(n, m - 3) Q(n, m - 4) Q(n, m) 1 0.929 0.864 0.751 0.347 Q(n, m - 1) 0.929 1 0.764 0.693 0.659 Q(n, m - 2) 0.864 0.764 1 0.814 0.732 Q(n, m - 3) 0.751 0.693 0.814 1 0.837 Q(n, m - 4) 0.347 0.659 0.732 0.837 1
下载: 导出CSV
表 6 同一时段当前工作日与临近工作日出行需求相关性分析
Table 6. Correlation analysis of trip demands between current working day and near working day in the same period
相关系数 Q(n, m) Q(n - 1, m) Q(n - 2, m) Q(n - 5, m) Q(n - 6, m) Q(n - 7, m) Q(n, m) 1 0.903 0.864 0.732 0.769 0.915 Q(n - 1, m) 0.903 1 0.912 0.803 0.751 0.794 Q(n - 2, m) 0.864 0.912 1 0.863 0.782 0.715 Q(n - 5, m) 0.732 0.803 0.863 1 0.859 0.814 Q(n - 6, m) 0.769 0.751 0.782 0.859 1 0.879 Q(n - 7, m) 0.915 0.794 0.715 0.814 0.879 1
下载: 导出CSV
表 7 BP神经网络参数设置
Table 7. Parameter setting of the BP neural network
BP神经网络 变量 输人层 11月22日、11月21日的出行需求量 输出层 11月23日的出行需求量 隐藏层 神经元数量: 11
下载: 导出CSV
表 8 早高峰不同模型对比效果
Table 8. Comparison of different models in the morning peak
模型 MAE RMSE MAPE /% BP神经网络(BP) 13.74 19.29 4.08 随机森林模型(RF) 26.25 31.29 7.33 岭回归模型(Ridge) 35.35 39.22 9.95
下载: 导出CSV
表 9 晚高峰不同模型对比效果
Table 9. Comparison of different models in the evening peak
模型 MAE RMSE MAPE /% BP神经网络(BP) 11.81 12.85 4.18 随机森林模型(RF) 20.06 21.10 7.16 岭回归模型(Ridge) 24.34 25.00 8.5
下载: 导出CSV
表 10 夜高峰不同模型对比效果
Table 10. Comparison of different models in the night peak
模型 MAE RMSE MAPE /% BP神经网络(BP) 7.31 8.69 3.36 随机森林模型(RF) 9.88 10.83 4.8 岭回归模型(Ridge) 12.4 12.64 5.94
下载: 导出CSV
-
[1] 曹梁. 基于出租车GPS数据的城市出行及碳排放时空变化研究[D]. 上海: 上海师范大学, 2018.CAO Liang. Spatiotemporal variation of urban travel and carbon emissions based on taxi GPS data[D]. Shanghai : Shanghai Normal University, 2018. (in Chinese) [2] 付鑫, 孙茂棚, 孙皓. 基于GPS数据的出租车通勤识別及时空特征分析[J]. 中国公路学报, 2017, 30(7): 134-143. doi: 10.3969/j.issn.1001-7372.2017.07.017FU Xin, SUN Maopeng, SUN Hao. Taxi commuting recognition and spatiotemporal characteristics analysis based on GPS da- ta[J]. China Journal of Highway and Transport, 2017, 30(7): 134-143. (in Chinese) doi: 10.3969/j.issn.1001-7372.2017.07.017 [3] 张俊涛, 武芳, 张浩. 利用出租车轨迹数据挖掘城市居民出行特征[J]. 地理与地理信息科学, 2015, 3(6): 104-108. doi: 10.3969/j.issn.1672-0504.2015.06.020ZHANG Juntao, WU Fang, ZHANG Hao. Mining travel characteristics of urban residents using taxi trajectory data[J]. Geography and Geo-Information Science, 2015, 31(6) : 104-108. (in Chinese) doi: 10.3969/j.issn.1672-0504.2015.06.020 [4] ALVAREZ-GARCIA J A, ORTEGA J A, GONZALEZ-ABRIL, L, et al. Trip destination prediction based on past GPS log using a hidden markov model[J]. Expert Systems with Applications, 2010, 37(12): 8166-8171. doi: 10.1016/j.eswa.2010.05.070 [5] 林基艳, 张雅琼, 张慧. 基于出租车GPS轨迹数据挖掘的居民出行特征研究[J]. 计算机时代, 2017(5): 37-39+41. https://www.cnki.com.cn/Article/CJFDTOTAL-JSJS201705012.htmLIN Jiyan, ZHANG Yaqiong, ZHANG Hui. Research on residents' travel characteristics based on taxi GPS trajectory data mining[J]. Computer Era, 2017(5) : 37-39+41. (in Chinese) https://www.cnki.com.cn/Article/CJFDTOTAL-JSJS201705012.htm [6] 何月, 工崇侣. 基于时空聚类的出租车载客热点区域挖掘研究[J]. 测绘与空间地理信息, 2020, 43(1): 99-102. doi: 10.3969/j.issn.1672-5867.2020.01.027HE Yue, WANG Chongqi. Mining hot spots of taxi passengers based on spatiotemporal clustering[J]. Geomatics & Spatial Information Technology, 2020, 43(1): 99-102. (in Chinese) doi: 10.3969/j.issn.1672-5867.2020.01.027 [7] TANG J J, WANG Y W, HAO W, et al. A mixed path size logit-based taxi customer-search model considering spatio-temporal factors in route choice[J]. IEEE Transactions on Intelligent Transportation Systems, 2020, 21(4) : 1347-1358. doi: 10.1109/TITS.2019.2905579 [8] ZHENG L J, XIA D, ZHAO X, et al. Spatial-temporal travel pattern mining using massive taxi trajectory data[J]. Physica A-Statistical Mechanics and its Applications, 2018, (501): 24-41. http://d.wanfangdata.com.cn/periodical/4c9e129e797251a1c4ac3136fc2aa28a [9] 工明. 基于出租车GPS数据的载客热点可视化的研究与应用[D]. 太原: 中北大学, 2018.WANG Ming. Research and application of passenger hotspot visualization based on taxi GPS data[D]. Taiyuan: North University of China, 2018. (in Chinese) [10] LUO T, ZHENG XW, XUGL, etal. An improved DBSCAN algorithm to detect stops in individual trajectories[J]. ISPRS International Journal of Geo-Information, 2017, 6 (3): 2673-2681. http://www.mdpi.com/2220-9964/6/3/63/pdf [11] 桂智明, 向宇, 李玉鉴. 基于出租车轨迹的并行城市热点区域发现[J]. 华中科技大学学报(自然科学版), 2012(增刊1): 187-190. https://www.cnki.com.cn/Article/CJFDTOTAL-HZLG2012S1045.htmGUI Zhiming, XIANG Yu, LI Yujian. Discovery of parallel urban hot spots based on taxi trajectories[J]. Journal of Hua- zhong University of Science and Technology, 2012 (S1): 187-190. (in Chinese) https://www.cnki.com.cn/Article/CJFDTOTAL-HZLG2012S1045.htm [12] 工郑委. 基于大数据Hadoop平台的出租车载客热点区域挖掘研究[D]. 北京: 北京交通大学, 2016.WANG Zhengwei, Research on hotspot area mining of taxi carrying passengers based on big data Hadoop platform[D]. Beijing : Beijing Jiaotong University, 2016. (in Chinese) [13] ZHANG L, LU J, ZHOU J, et al. Complexities' day-to-day dynamic evolution analysis and prediction for a Didi taxi trip network based on complex network theory[J]. Modern Physics Letters B, 2018, 32(9): 1850062. doi: 10.1142/S0217984918500628 [14] 工芮. 基于GPS数据的城市出租车出行需求研究[D]. 济南: 山东大学, 2016.WANG Rui. Study on urban taxi travel demand based on GPS data[D]. Jinan : Shandong University, 2016. (in Chinese) [15] 席殷飞, 刘钟锴, 杨佩云, 等. 网约车出行需求预测方法[J]. 上海大学学报(自然科学版), 2020, 26(3): 328-341. https://www.cnki.com.cn/Article/CJFDTOTAL-SDXZ202003002.htmXI Yinfei, LIU Zhongkai, YANG Peiyun, et al. Car-hailing travel demand prediction method[J]. Journal of Shanghai University (Natural Science), 2020, 26 (3) : 328-341. (in Chi - nese) https://www.cnki.com.cn/Article/CJFDTOTAL-SDXZ202003002.htm [16] 张文胜, 郝孜奇, 朱冀军, 等. 基于改进灰狼算法优化BP神经网络的短时交通流预测模型[J]. 交通运输系统工稈与信息, 2020, 20(2): 196-203. https://www.cnki.com.cn/Article/CJFDTOTAL-YSXT202002030.htmZHANG Wensheng, HAO Ziqi, ZHU Jijun, et al. Short-time traffic flow prediction model was optimized by BP neural network based on improved gray wolf optimizer[J]. Journal of Transportation Systems Engineering and Information Technology, 2020, 20 (2): 196-203. (in Chinese) https://www.cnki.com.cn/Article/CJFDTOTAL-YSXT202002030.htm [17] 叶秀秀, 马晓风, 钟鸣, 等. 基于局部路网空间结构特征的无检测器路段交通流预测方法[J]. 交通信息与安全, 2021, 39(2): 137-144. doi: 10.3963/j.jssn.1674-4861.2021.02.017YE Xiuxiu, MA Xiaofeng, ZHONG Ming, et al. Traffic flow prediction method based on spatial structure characteristics of local road network without detector[J]. Journal of Transport Information and Safety, 2021, 39(2) : 137-144. (in Chinese) doi: 10.3963/j.jssn.1674-4861.2021.02.017 [18] YANG J, DONG X C, JIN S G. Metro passenger flow prediction model using attention-based neural network[J]. IEEE AC- CESS, 2020(8) : 30953-30959. [19] WANG J C, WANG Y, YANG J G. Forecasting of significant wave height based on gated recurrent unit network in the taiwan strait and its adjacent waters[J]. WATER, 2021, 13(1). http://www.researchgate.net/publication/348203282_Forecasting_of_Significant_Wave_Height_Based_on_Gated_Recurrent_Unit_Network_in_the_Taiwan_Strait_and_Its_Adjacent_Waters [20] 李岩. 基于热点区域的出租车出行需求预测模型研究[D]. 西安: 长安大学, 2019.LI Yan. Research on taxi travel demand forecasting model based on hot spots[D]. Xi' an: Chang' an University, 2019. (in Chinese) -


 点击查看大图

计量
- 文章访问数: 1075
- HTML全文浏览量: 631
- PDF下载量: 83
- 被引次数: 0