

A Method for Identifying Drivers' Risk Perception Based on LightGBM
-
摘要: 碰撞风险与风险感知能力有关, 为准确评估驾驶人风险感知能力, 设计考虑危险源个数与类型的驾驶模拟试验, 采集危险场景下的驾驶人驾驶行为与眼动特征等数据。利用Mantel-Haenszel检验分析危险源因素、驾驶人个人特性在不同风险感知水平人群下的差异性, 借助Spearman相关性分析探索驾驶行为、眼动特征与风险感知能力之间的关系。结果表明: 危险源个数、类型与风险感知能力负相关。驾龄、车速、纵向加速度、刹车深度、制动反应时间及位置等与风险感知能力显著相关。风险感知能力迟钝的驾驶人车速偏高且加速度更大, 刹车深度更深, 从发现危险事件到采取行动需要更多的反应时间。构建综合风险感知能力评价指标集, 借助Random Forest算法对特征进行重要性排序, 在此基础上利用LightGBM算法建立驾驶人风险感知能力判别模型, 分析不同特征个数输入对模型性能的影响。结果表明: 与SVM和AdaBoost等算法相比, 基于LightGBM算法的模型F1值达到86.07%, 精度为86.14%, 可以有效地对不同风险感知等级的驾驶人进行分类。
-
关键词:
- 交通安全 /
- 风险感知 /
- 危险源 /
- LightGBM算法
Abstract: Accident risk is related to risk perception, and a driving simulation is designed to evaluate the ability of drivers' risk perception considering hazard target' type(explicit/implicit)and amount(single/double). Data of driving behaviors and eye movement characteristics is collected under different risk scenarios. Mantel-Haenszel test is used to analyze differences of hazard target' factors and drivers' characteristics under different risk perception levels. The Spearman correlation test is used to study relationships among driving behaviors, eye movement characteristics, and risk perception ability. The results show that hazard target' factors are negatively correlated with risk perception. Driving age, vehicle speed, longitudinal acceleration, braking depth, braking response time, and response position are significantly related to risk perception. Drivers with poor risk perception would drive at higher speeds with faster acceleration and deeper brake. They need more time to react to emergencies. The evaluation set of risk perception ability is constructed, and the importance of features is ranked using the Random Forest algorithm. The model of risk perception is built based on LightGBM with the effects of different features analyzed. The results show that the identification effect of the model is the best based on LightGBM compared with SVM and AdaBoost. The F1 value reaches 86.07%with an accuracy of 86.14%, which can classify drivers with different risk perception levels.-
Key words:
- traffic safety /
- risk perception /
- hazard target /
- LightGBM algorithm
-

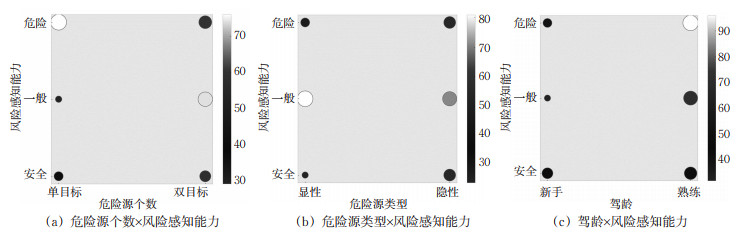
图 3 危险源个数、危险源类型、性别与风险感知能力散点图
Figure 3. Relationship between risk perception, target number, target type, and gender

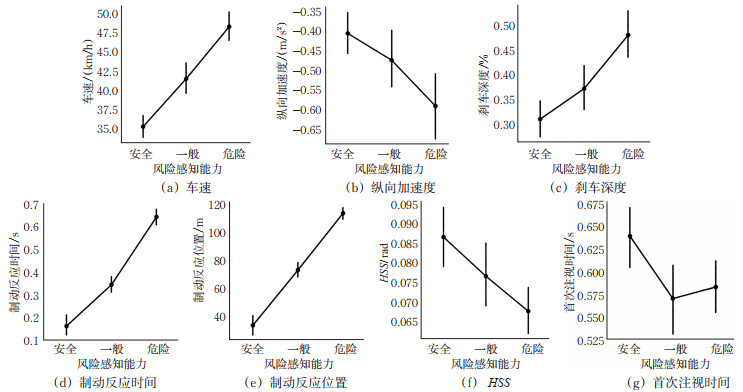
图 4 显著因子在风险感知能力下的分布图
Figure 4. Distribution of significance factors under risk perception
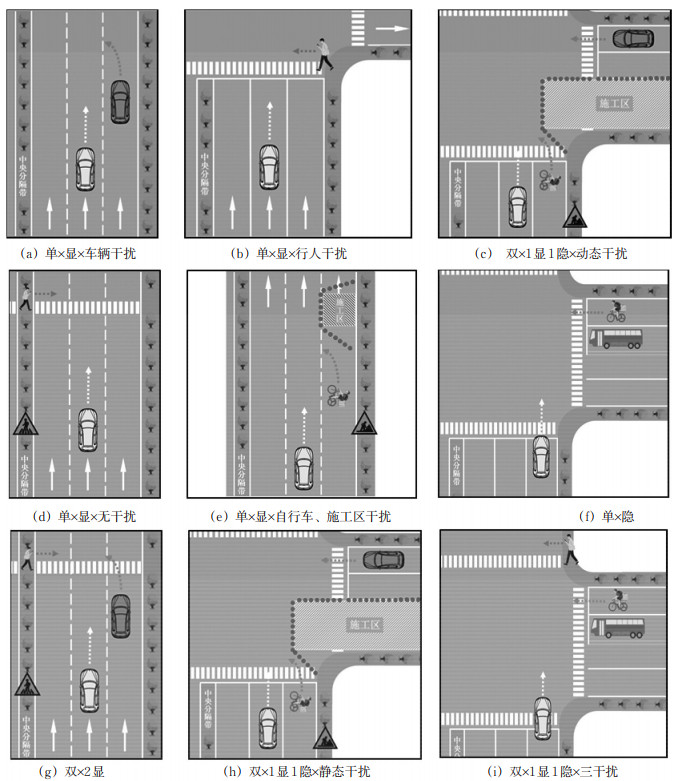
表 1 危险场景描述
Table 1. Description of risk scenarios
序号 场景描述 冲突类型 图示 1 主车行驶于中间车道,其右前方行驶1辆小汽车 干扰 2 主车正穿过交叉口,其右侧人行横道有行人同向行走 干扰 3 主车正行驶于中间车道,其右前方有1名骑行者正前进 干扰 4 主车行驶于中间车道,其右前方有1辆小汽车打左转向灯3 s后向左换道至主车所在车道 机动车 图 2(a) 5 直行方向为绿灯,主车欲穿行交叉口,前方有1名行人突然冲入人行横道意欲穿行 行人 图 2(b) 6 直行方向为绿灯,主车行驶于最右车道,欲穿行交叉口,其右侧有1名骑行者欲换道,右侧交叉口处有1处施工围挡区,施工区前50 m处有前方施工标志,此时1辆小汽车欲从隔离围挡后面驶出 机动车、非机动车 图 2(c) 7 主车行驶于中间车道,行人被中央分隔带遮挡,人行横道前50 m处设有注意行人标志。当主车接近人行横道时,1名行人突然从中央分隔带处闯入人行横道并跑到道路右侧 行人 图 2(d) 8 主车行驶于中间车道,其右前方有1名骑行者,其所在车道被施工区阻碍,骑行者左换道至主车所在车道 非机动车 图 2(e) 9 主车行驶于最右车道,欲直行穿行交叉口,此时直行方向刚由红灯变为绿灯。其右前方交叉口处有1辆公交车停在交叉口旁等待绿灯通行,此时1名骑行者从公交车后冲出,并进入交叉口内 非机动车 图 2(f) 10 主车行驶于中间车道,其右前方有1辆小汽车亦正向前行驶,前方有人行横道,人行横道前50 m处有注意行人标志。右前方的小汽车打左转向灯3 s后于人行横道处向左换道至主车所在车道,而后,1名被中央分隔带植物所遮挡的行人突然穿过人行横道至道路右侧 机动车、非机动车 图 2(g) 11 主车正准备接近交叉口,其右前方有1名骑行者。交叉口处有施工围挡区,施工区前50 m处有前方施工标志,该施工区阻碍了骑行者的行进路线,因此,骑手向左换道至主车所在车道并加速驶离,而后,从隔离围挡区后驶出1辆小汽车 机动车、非机动车 图 2(h) 12 主车正以一定速度欲直行通过前方交叉口,此时直行方向刚由红灯变为绿灯,其右前方有行人准备通过马路,右前方交叉口处停有1辆公交车,此时行人突然快速通过人行横道,而后,公交车后有1辆自行车冲出,并进入交叉口内 行人、非机动车 图 2(i)  下载: 导出CSV
表 2 风险感知能力分类标准
Table 2. Standard for classifying risk perception
TTC < 3 s 3~5.5 s > 5.5 s 风险感知等级 高(危险) 中(一般) 低(安全)
下载: 导出CSV
表 3 Search算法的模型参数优化
Table 3. Optimization of model parameters based on the Grid Search algorithm
参数 范围 优化结果 max-depth (1, 8, 1) 5 num-leaves (3, 31, 1) 10 min-data-in-leaf (1, 102, 10) 11 学习控制参数 feature-fraction [0.6, 0.7, 0.8, 0.9, 1.0] 0.6 bagging-fraction [0.6, 0.7, 0.8, 0.9, 1.0] 0.6 lambda-11 [1e-5,1e-3,1e-1,0.0, 0.1,0.3, 0.5, 0.7, 0.9,1.0] 0.1 lambda-12 [1e-5,1e-3,1e-1,0.0, 0.1,0.3, 0.5, 0.7, 0.9,1.0] 1e-05 min-split-gain [0.0, 0.1,0.2, 0.3, 0.4, 0.5, 0.6, 0.7, 0.8, 0.9,1.0] 0.0 IO参数 max-bin (5, 256) 251
下载: 导出CSV
表 4 Mantel-Haenszel检验结果
Table 4. Results of Mantel-Haenszel test
变量 线性间的联合检验 卡方 自由度 相关系数Cor 显著性(双侧)p 危险源个数 8.40 1 -0.159 0.004 危险源类型 25.96 1 -0.279 < 0.001 驾龄 8.98 1 0.164 0.003 性别 0.95 1 -0.053 0.329
下载: 导出CSV
表 5 危险源个数、危险源类型、驾龄与风险感知能力交叉表
Table 5. Crosstabulation among risk perception, target number, target type, and driving years
风险感知能力 总计 安全 一般 危险 危险源个数 单目标 计数 37 29 76 142 期望计数 40.4 43.8 57.8 142 占危险源个数百分比/% 26.1 20.4 53.5 100.0 占风险感知能力百分比/% 38.9 28.2 55.9 42.5 双目标 计数 58 74 60 192 期望计数 54.6 59.2 78.2 192 占危险源个数百分比/% 30.2 38.5 31.3 100.0 占风险感知能力百分比/% 61.1 71.8 44.1 57.5 危险源类型 显性 计数 24 48 81 153 期望计数 43.5 47.2 62.3 153 占危险源类型百分比/% 15.7 31.4 52.9 100.0 占风险感知能力百分比/% 25.3 46.6 59.6 45.8 隐性 计数 71 55 55 181 期望计数 51.5 55.8 73.7 占危险源类型百分比/% 39.2 30.4 30.4 100.0 占风险感知能力百分比/% 74.7 53.4 40.4 54.2 驾龄 新手 计数 47 32 40 119 期望计数 33.8 36.7 48.5 119 占驾龄百分比/% 39.5 26.9 33.6 100.0 占风险感知能力百分比/% 49.5 31.1 29.4 35.6 熟练 计数 48 71 96 215 期望计数 61.2 66.3 87.5 215 占驾龄百分比/% 22.3 33.0 44.7 100.0 占风险感知能力百分比/% 50.5 68.9 70.6 64.4
下载: 导出CSV
表 6 描述性分析
Table 6. Descriptive analysis
指标 风险感知能力 高(危险) 中(一般) 低(安全) 车速/(km/h) 均值 48.56 41.70 35.40 标准差 11.15 10.10 7.56 纵向加速度/(m/s3) 均值 -0.59 -0.48 -0.41 标准差 0.51 0.37 0.26 方向盘旋转率/s-1 均值 -0.002 5 -0.000 8 -0.001 4 标准差 0.738 3 0.0197 0.019 2 刹车深度/% 均值 48 37 31 标准差 27 23 18 制动反应时间/s 均值 0.65 0.35 0.17 标准差 0.22 0.19 0.22 制动反应位置/m 均值 114.96 74.13 34.36 标准差 24.64 26.58 35.93 注视次数/次 均值 28.54 30.52 26.89 标准差 11.09 15.20 13.41 首次注视时间/s 均值 0.58 0.56 0.64 标准差 0.18 0.22 0.19 VSS/rad 均值 0.045 0.044 0.049 标准差 0.24 0.02 0.03 HSS/rad 均值 0.068 0.078 0.087 标准差 0.35 0.04 0.03
下载: 导出CSV
表 7 Spearman相关结果
Table 7. Results of Spearman correlation
特征 相关系数 显著性(双尾) 特征 相关系数 显著性(双尾) 车速 0.508 < 0.001 制动反应位置 0.742 < 0.001 纵向加速度 -0.162 0.003 VSS -0.013 0.813 方向盘旋转率 0.052 0.341 HSS -0.202 < 0.001 刹车深度 0.279 < 0.001 注视次数 0.028 0.608 制动反应时间 0.734 < 0.001 首次注视时间 -0.114 0.037
下载: 导出CSV
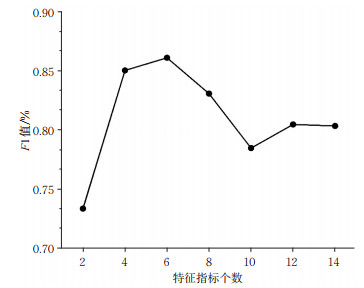
表 8 不同特征数下的模型性能
Table 8. Performance evaluation indicators of different features
% 特征个数 评价指标 F1值 precision recall accuracy 2 73.33 73.60 73.27 73.27 4 85.00 85.67 85.15 85.15 6 86.07 86.41 86.14 86.14 8 83.04 84.53 83.17 83.17 10 78.44 80.93 78.22 78.22 12 80.44 82.72 80.20 80.20 14 80.31 83.43 80.20 80.20
下载: 导出CSV
表 9 3种模型的性能比较
Table 9. Performance of three models
% 算法 评价指标 F1值 precision recall accuracy LightGBM 86.07 86.41 86.14 86.14 SVM 77.37 78.79 77.23 77.23 AdaBoost 78.51 78.58 78.22 78.22
下载: 导出CSV
-
[1] 艾倩楠. 基于驾驶员指标的驾驶员风险感知水平评价[J]. 中国安全科学学报, 2018, 28(12): 144-149. https://www.cnki.com.cn/Article/CJFDTOTAL-ZAQK201812024.htmAI Qiannan. Evaluation of driver risk perception level based on driver indicators[J]. China Safety Science Journal, 2018, 28(12): 144-149. (in Chinese). https://www.cnki.com.cn/Article/CJFDTOTAL-ZAQK201812024.htm [2] SIREN A, KJÆR M R. How is the older road users'perception of risk constructed?[J]. Transportation Research Part F: Traffic Psychology and Behaviour, 2011, 14(3): 222-228. doi: 10.1016/j.trf.2011.01.002 [3] HORSWILL M S, MCKENNA F P. Drivers'hazard perception ability: situation awareness on the road[J]. A Cognitive Approach to Situation Awareness: Theory and Application, 2004, 1(9): 155-175. http://www.researchgate.net/profile/Frank_Mckenna2/publication/271767714_Drivers'_hazard_perception_ability_Situation_awareness_on_the_road/links/5665a1c808ae418a786f1af0 [4] CRUNDALL D, KROLL V. Prediction and perception of hazards in professional drivers: Does hazard perception skill differ between safe and less-safe fire-appliance drivers?[J]. Accident Analysis & amp; Prevention, 2018(121): 335-346. http://www.sciencedirect.com/science?_ob=ShoppingCartURL&_method=add&_eid=1-s2.0-S0001457518301970&originContentFamily=serial&_origin=article&_ts=1526696796&md5=c44700b2eed87a5b83ac6005daee9a50 [5] 张晖, 严新平, 尤志栋, 等. 驾驶人安全意识提升方法与实现[J]. 交通信息与安全, 2011, 29(6): 89-93. doi: 10.3963/j.ISSN1674-4861.2011.06.021ZHANG Hui, YAN Xinping, YOU Zhidong, et al. Method andrealization of driving safety awareness enhancement[J]. Journal of Transport Information and Safety, 2011, 29(6): 89-93. (in Chinese). doi: 10.3963/j.ISSN1674-4861.2011.06.021 [6] HORSWILL M S. Hazard perception in driving[J]. Current Directions in Psychological Science, 2016, 25(6): 425-430. doi: 10.1177/0963721416663186 [7] HORSWILL M S, HILL A, WETTON M. Can a video-based hazard perception test used for driver licensing predict crash involvement?[J]. Accident Analysis & amp; Prevention, 2015(82): 213-219. http://d.wanfangdata.com.cn/periodical/ChlQZXJpb2RpY2FsRW5nTmV3UzIwMjEwMzAyEiA3NGQ4ZGM1YjdkNTFmMjk0MjYwNDkxODVhZWJiYjI0NhoIZzl2MmlyNnk%3D [8] BOROWSKY A, SHINAR D, ORON-GILAD T. Age, skill, and hazard perception in driving[J]. Accident Analysis & amp; Prevention, 2010, 42(4): 1240-1249. http://drivingassessment.uiowa.edu/DA2007/PDF/089_BorowskyShinar.pdf [9] UNDERWOOD G, CRUNDALL D, CHAPMAN P. Driving simulator validation with hazard perception[J]. Transportation Research Part F: Traffic Psychology and Behaviour, 2011, 14(6): 435-446. doi: 10.1016/j.trf.2011.04.008 [10] 王丰元, 陈晓婷. 虚拟试验下驾龄对驾驶人危险感知特性的影响[J]. 现代交通技术, 2018, 15(1): 61-64. doi: 10.3969/j.issn.1672-9889.2018.01.017WANG Fengyuan, CHEN Xiaoting. Influence of driving age on drivers'danger perception characteristics under virtual experiment[J]. Modern Traffic Technology, 2018, 15(1): 61-64. (in Chinese). doi: 10.3969/j.issn.1672-9889.2018.01.017 [11] 文森, 梁波, 肖尧, 等. 基于反应时间的公路隧道接近段停车视距研究[J]. 交通信息与安全, 2021, 39(2): 43-52.WEN Sen, LIANG Bo, XIAO Yao, et al. Research on stop-up visual distance of highway tunnel approach based on response time[J]. Journal of Transport Information and Safety, 201, 39(2): 43-52. (in Chinese). [12] PARK S W, CHOI E S, LIM M H, et al. Association between unsafe driving performance and cognitive-perceptual dysfunction in older drivers[J]. PM & amp; R, 2011, 3(3): 198-203. http://www.sciencedirect.com/science?_ob=ShoppingCartURL&_method=add&_eid=1-s2.0-S1934148210013572&originContentFamily=serial&_origin=article&_ts=1496624436&md5=5c78a9a31976143c935949bdbd1c3dcf [13] LIANG B, LIN Y. Using physiological and behavioral measurements in a picture-based road hazard perception experiment to classify risky and safe drivers[J]. Transportation Research Part F: Traffic Psychology and Behaviour, 2018(58): 93-105. http://www.onacademic.com/detail/journal_1000040427726710_1d28.html [14] 谷志朋, 杨京帅, 楚彭子, 等. 基于危险源位置的驾驶人危险感知研究[J]. 武汉理工大学学报(交通科学与工程版), 2020, 44(5): 789-793. doi: 10.3963/j.issn.2095-3844.2020.05.004GU Zhipeng, YANG Jingshuai, CHU Pengzi, et al. Study on drivers'danger perception based on danger source location[J]. Journal of Wuhan University of Technology(Traffic Science & amp; Engineering), 2020, 44(5): 789-793. (in Chinese). doi: 10.3963/j.issn.2095-3844.2020.05.004 [15] ADAMO S H, CAIN M S, MITROFF S R. Self-induced attentional blink: A cause of errors in multiple-target search[J]. Psychological Science, 2013, 24(12): 2569-2574. doi: 10.1177/0956797613497970 [16] SALL R J, FENG J. Dual-target hazard perception: Could identifying one hazard hinder a driver's capacity to find a second?[J]. Accident Analysis & amp; Prevention, 2019(131): 213-224. http://www.sciencedirect.com/science/article/pii/S0001457518311011 [17] LI Y, ZHENG Y, WANG J, et al. Crash probability estimation via quantifying driver hazard perception[J]. Accident Analysis & amp; Prevention, 2018(116): 116-125. http://www.onacademic.com/detail/journal_1000039927060210_9f53.html [18] TŪSKĖ V, ŠEIBOKAITĖ L, ENDRIULAITIENĖ A, et al. Hazard perception test development for lithuanian drivers[J]. IATSS Research, 2019, 43(2): 108-113. doi: 10.1016/j.iatssr.2018.10.001 [19] 王至恒. 基于车辆运行参数的驾驶危险状态辨识仿真研究[D]. 西安: 长安大学, 2018.WANG Zhiheng. Simulation research on driving hazard state identification based on vehicle operating parameters[D]. Xi'an: Chang'an University, 2018. (in Chinese). [20] 薛清文, 蒋愚明, 陆键. 基于轨迹数据的危险驾驶行为识别方法[J]. 中国公路学报, 2020, 33(6): 84-94. doi: 10.3969/j.issn.1001-7372.2020.06.008XUE Qingwen, JIANG Yuming, LU Jian. A method for identification of dangerous driving behavior based on trajectorydata[J]. China Journal of Highway and Transport, 2020, 33(6): 84-94. (in Chinese). doi: 10.3969/j.issn.1001-7372.2020.06.008 [21] 张晖, 肖逸影, 吴超仲, 等. 中国危险品车辆驾驶人驾驶行为影响因素分析[J]. 交通信息与安全, 2020, 38(5): 137-144+153. doi: 10.3963/j.jssn.1674-4861.2020.05.016ZHANG Hui, XIAO Yiying, WU Chaozhong, et al. Analysis of factors influencing driving behavior of dangerous goods vehicle drivers in china[J]. Journal of Transport Information and Safety, 2020, 38(5): 137-144+153. (in Chinese). doi: 10.3963/j.jssn.1674-4861.2020.05.016 [22] LONG S, RUOSONG C. Effects of self-assessed ability and driving experience on hazard perception[J]. Journal of Psychological Science, 2016, 39(6): 1346-1352. http://www.psysci.org/CN/article/downloadArticleFile.do?attachType=PDF&id=9791 [23] HILL A, HORSWILL M S, WHITING J, et al. Computer-based hazard perception test scores are associated with the frequency of heavy braking in everyday driving[J]. Accident Analysis & amp; Prevention, 2019(122): 207-214. http://www.ncbi.nlm.nih.gov/pubmed/30390516 [24] 黄兆国, 过秀成, 贾亮. 基于随机森林的雨天车辆跟驰风险行为研究[J]. 交通信息与安全, 2020, 38(1): 27-34. https://www.cnki.com.cn/Article/CJFDTOTAL-JTJS202001007.htmHUANG Zhaoguo, GUO Xiucheng, JIA Liang. Study on risk behavior of vehicle following in rainy day based on random forest[J]. Journal of Transport Information and Safety, 2020, 38(1): 27-34. (in Chinese). https://www.cnki.com.cn/Article/CJFDTOTAL-JTJS202001007.htm -


 点击查看大图
计量
- 文章访问数: 491
- HTML全文浏览量: 151
- PDF下载量: 46
- 被引次数: 0