

A Quantitative Analysis on Urban Bus Emissions and Energy Consumptions under Different Road Speeds and Dwell Time
-
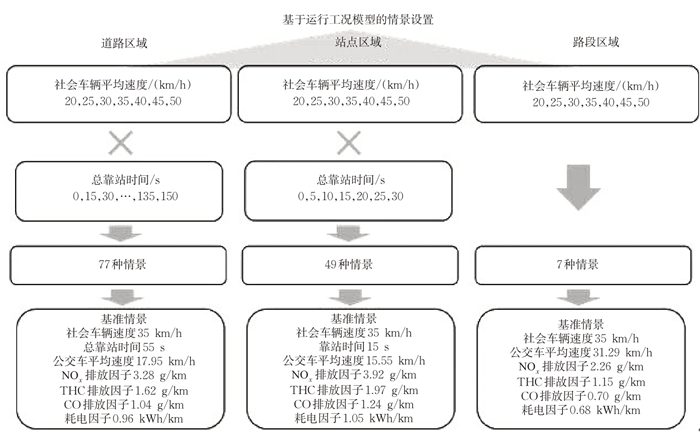
摘要: 为定量探究不同运行区域下社会车辆速度和靠站时间对城市客车排放耗电水平的影响,以燃气和纯电动公交车为研究对象,收集了5条公交线路共75万多条GPS数据和大量的浮动车辆数据,建立不同运行区域下城市公交车运行工况预测模型及排放能耗预测模型,并进行定量影响分析。结果显示:在道路区域下,社会车辆速度相较靠站时间对公交车排放能耗的影响更大,社会车辆平均速度每增加5 km/h,公交车相对速度的增幅可达0.17,相对排放因子和相对耗电因子的降幅可达0.11和0.06。在站点区域下,靠站时间对公交车排放能耗的影响稍高于社会车辆速度的影响,靠站时间每减少15 s,公交车平均速度的增幅可达0.11,相对排放因子和相对耗电因子的降幅均为0.06。研究发现,不同情境下提升社会车辆速度并非总能明显降低公交车排放能耗,因此,在复杂的现实运行环境中应当对交通运行效率与排放能耗进行综合评价和协同控制。Abstract: A model for estimating gas or electric bus operating conditions and emissions (or energy consumptions) is developed to quantify urban bus emissions and energy consumptions under different road speeds and dwell time at different locations. This model is developed by more than 750 thousand GPS records of 5 bus lines and a large amount of floating vehicle data. The result shows that in road areas, the road speed of mixed traffic flow has a greater impact on bus emission and energy consumption than dwell time at bus stops. As the road speed increases by 5 km/h, the relativebus speed increases by 0.17, and the relative emission factor and relative energy consumption factor decrease by 0.11 and 0.06, respectively. In the bus stop area, the dwell time at the bus stop has a greater impact on bus emissions and energy consumptions than the speed on the road.As the dwell time decreases by 15 seconds; the relative bus speed increases by 0.11; the relative emission factor and relative energy consumption factor both decrease by 0.06. Increasing the speed on the road at different locations does not always significantly reduce bus emissions and energy consumptions. Thus, cooperative control of bus operation efficiency and emissions (or energy consumptions) should be carried out in the comprehensive traffic system.
-
Key words:
- traffic environment /
- bus /
- emission and energy consumption /
- quantitative analysis
-

图 1 广州市公交车GPS采集实验线路
Figure 1. Experimental bus lines for collecting GPS data in Guangzhou

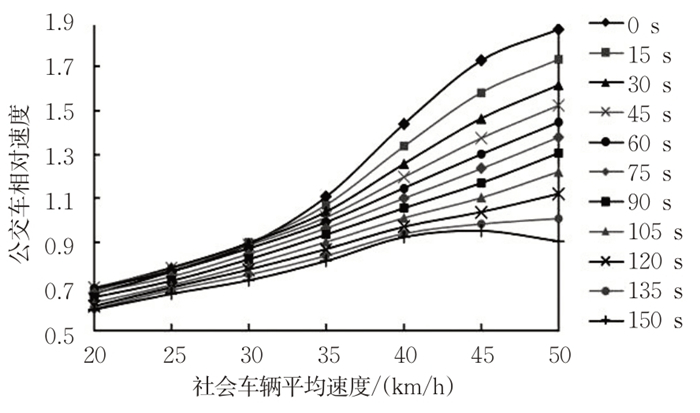
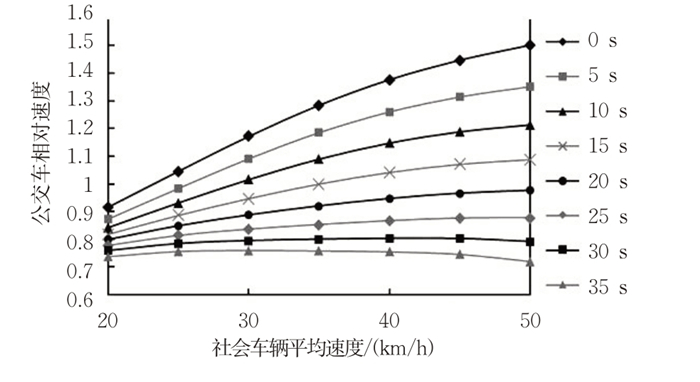
图 3 道路区域下社会车辆速度、靠站时间对公交车相对速度的影响
Figure 3. Relative bus speed influenced by the speed on the road and dwell time in road areas

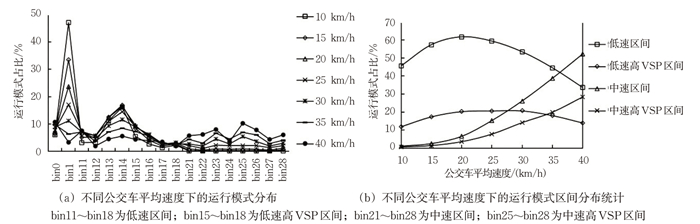
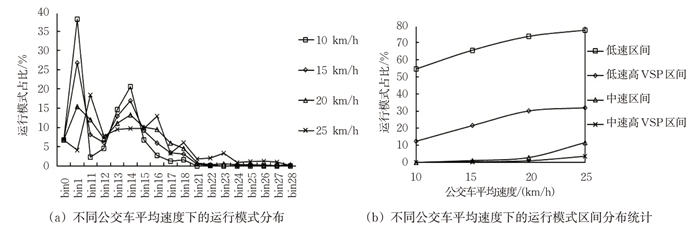
图 4 道路区域下社会车辆速度、总靠站时间对公交车运行工况的影响
Figure 4. Bus operating mode distributions influenced by the speed on the road and dwell time in road areas

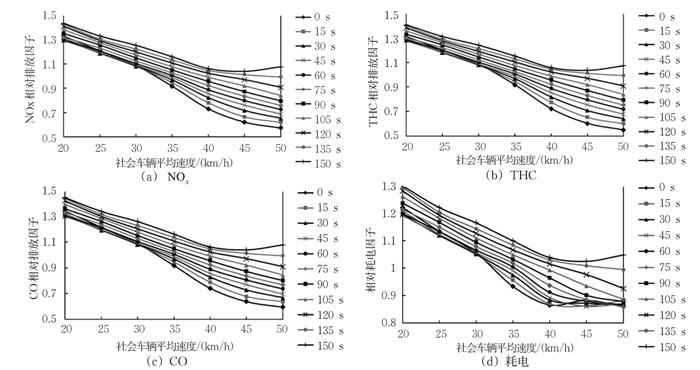
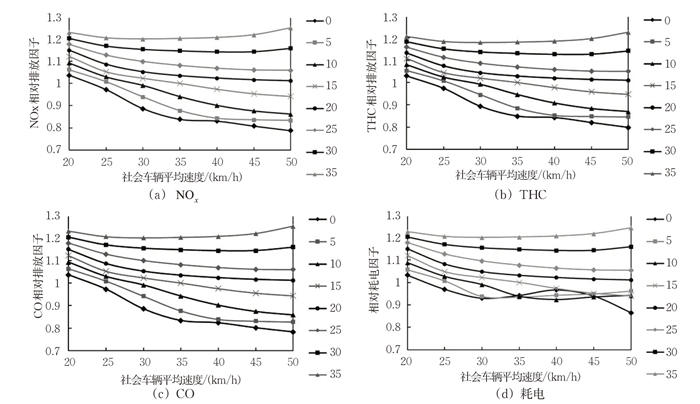
图 5 道路区域下社会车辆速度、总靠站时间对公交车相对排放、耗电因子的影响
Figure 5. Relative bus emission factors and electricity consumption factor influenced by the speed on the road and the dwell time in road areas

图 6 站点区域下社会车辆速度、靠站时间对公交车相对速度的影响
Figure 6. Relative bus speed influenced by the speed on the road and the dwell time in bus-stop areas

图 7 站点区域下社会车辆速度、总靠站时间对公交车运行工况的影响
Figure 7. Bus operating-mode distributions influenced by the speed on the road and the dwell time in bus stop areas

图 8 站点区域下社会车辆速度、靠站时间对公交车相对排放、耗电因子的影响
Figure 8. Relative bus emission factors and electricity consumption factor influenced by the speed on the road and the dwell time in bus-stop areas

图 9 路段区域下社会车辆速度对公交车相对速度的影响
Figure 9. Relative bus speed influenced by the speed on the road in sections

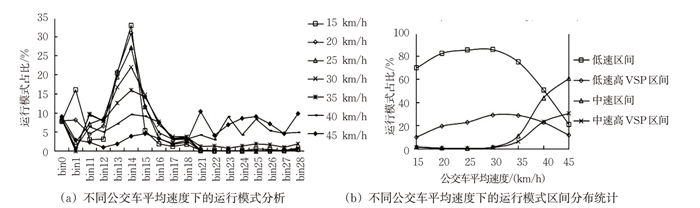
图 10 路段区域下社会车辆速度对公交车运行工况的影响
Figure 10. Bus operating-mode distributions influenced by the speed on the road in sections

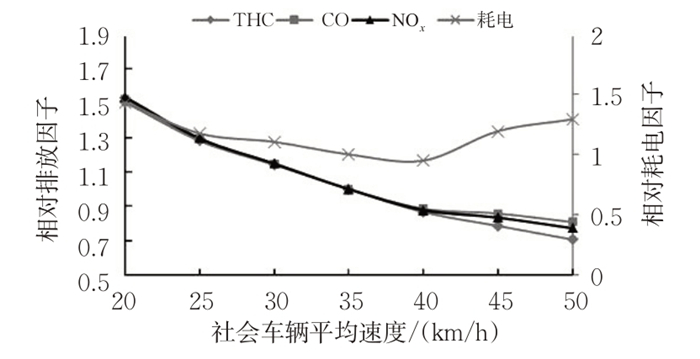
图 11 路段区域下社会车辆速度对公交车相对排放、耗电因子的影响
Figure 11. Relative bus-emission factors and electricity consumption factor influenced by the speed on the road in sections
表 1 不同运行区域下公交车GPS样本示例
Table 1. Result of buses' GPS samples at different locations
运行区域 道路/站点名称 社会车辆平均速度/(km/h) 靠站时间/s 公交车平均速度/(km/h) bin0占比/% … bin28占比/% 道路 新港西路 16.34 76 16.95 7.64 … 0 ⋮ ⋮ ⋮ ⋮ ⋮ ⋮ ⋮ 路段 滨江西路 18.13 17.24 3.36 … 0 ⋮ ⋮ ⋮ ⋮ ⋮ ⋮ 站点 广船站 39.39 21 13.85 10.64 … 0 ⋮ ⋮ ⋮ ⋮ ⋮ ⋮ ⋮  下载: 导出CSV
表 2 不同运行区域下公交车平均速度及运行工况模拟平均相对误差
Table 2. MAPE of the predicted average speed of buses and predicted operating mode distributions at different locations
% 运行区域 平均速度平均相对误差 耗电因子平均相对误差 NOx排放因子平均相对误差 THC排放因子平均相对误差 CO排放因子平均相对误差 道路 15.25 10.98 11.90 13.08 11.28 路段 19.71 36.28 20.52 24.29 17.64 站点 18.92 34.16 13.46 13.22 12.66
下载: 导出CSV
表 3 不同靠站时间下,社会车辆速度的变化对道路区域下公交车运行速度的影响分析
Table 3. Effect of the speed on the road on the bus speed under different dwell time in road areas
运行区域 靠站时间/s 社会车辆速度每增加5 km/h,公交车相对速度的平均变化值/% 道路区域 0~45 +17 60~105 +11 120~150 +7
下载: 导出CSV
表 4 不同社会车辆速度下,靠站时间的变化对道路区域下公交车运行速度的影响分析
Table 4. Effect of the dwell time on the bus speed under different speeds on the road in road areas
运行区域 社会车辆平均速度/(km/h) 靠站时间每增加15/s,公交车相对速度的平均变化值/% 道路区域 20~30 -1 35~40 -4 45~50 -9
下载: 导出CSV
表 5 不同靠站时间下,社会车辆速度的变化对道路区域下公交车排放能耗的影响分析
Table 5. The effect of road speed on bus emissions and electricity consumptions under different dwell time in road areas
运行区域 靠站时间/s 社会车辆速度每增加5 km/h,公交车相对排放因子的平均变化值/% 社会车辆速度每增加5 km/h,公交车相对耗电因子的平均变化值/% 道路区域 0~45 -11 -6 60~105 -9 -6 120~150 -7 -5
下载: 导出CSV
表 6 不同社会车辆速度下,靠站时间的变化对道路区域下公交车排放能耗的影响分析
Table 6. Effect of dwell time on bus emissions and electricity consumptions under different speeds on the road
运行区域 社会车辆平均速度/(km/h) 靠站时间每增加15/s,公交车相对排放因子的平均变化值/% 靠站时间每增加15/s,公交车相对耗电因子的平均变化值/% 道路区域 20~30 +1 +1 35~40 +3 +2 45~50 +5 +2
下载: 导出CSV
表 7 不同靠站时间下,社会车辆速度的变化对站点区域下公交车运行速度的影响分析
Table 7. Effect of the speed on the road on the bus speed under different dwell time in bus-stop areas
运行区域 靠站时间/s 社会车辆速度每增加5 km/h,公交车相对速度的平均变化值/% 站点区域 0~10 +8 15~20 +4 25~30 +1
下载: 导出CSV
表 8 不同社会车辆速度下,靠站时间的变化对站点区域下公交车运行速度的影响分析
Table 8. Effect of the dwell time on the bus speed under different speeds on the road in bus-stop areas
运行区域 社会车辆平均速度/(km/h) 靠站时间每增加15 s,公交车相对速度的平均变化值/% 站点区域 20~30 -4 35~40 -9 45~50 -11
下载: 导出CSV
表 9 不同靠站时间下,社会车辆速度的变化对站点区域下公交车排放能耗的影响分析
Table 9. Effect of the speed on the road on bus emissions and electricity consumptions under different dwell time in bus-stop areas
运行区域 靠站时间/s 社会车辆速度每增加5km/h,公交车相对排放因子的平均变化值/% 社会车辆速度每增加5km/h,公交车相对耗电因子的平均变化值/% 站点区域 0~10 -4 -2 15~20 -3 -3 25~30 -1 -1
下载: 导出CSV
表 10 不同社会车辆速度下,总靠站时间的变化对站点区域下公交车排放能耗的影响分析
Table 10. Effect of the dwell time on bus emissions and electricity consumptions under different speeds on the road in bus-stop areas
运行区域 社会车辆平均速度/(km/h) 靠站时间每增加15/s,公交车相对排放因子的平均变化值/% 靠站时间每增加15/s,公交车相对耗电因子的平均变化值/% 站点区域 20~30 +4 +3 35~40 +5 +3 45~50 +6 +4
下载: 导出CSV
-
[1] HADAS Y, NAHUM O E. Urban bus network of priority lanes: A combined multi-objective, multi-criteria and group decision-making approach[J]. Transport Policy, 2016(52): 186-196. http://toledo.net.technion.ac.il/files/2016/07/YuvalHadas_ERANETworkshop.pdf [2] GULER S I, GAYAH V V, MENENDEZ M. Bus priority at signalized intersections with single-lane approaches: A novel pre-signal strategy[J]. Transportation Research Part C: Emerging Technologies, 2016(63): 51-70. http://smartsearch.nstl.gov.cn/paper_detail.html?id=3b6e93dacd7a64d8ebc82bb50c5ee9c6 [3] ZHOU L, WANG Y Z, LIU Y D. Active signal priority control method for bus rapid transit based on vehicle infrastructure integration[J]. International Journal of Transportation Science and Technology, 2017, 6(2): 99-109. doi: 10.1016/j.ijtst.2017.06.001 [4] CHEN X H, SHAN X N, YE J H, et al. Evaluating the Effects of Traffic congestion and passenger load on feeder bus fuel and emissions compared with passenger car[J]. Transportation Research Procedia, 2017(25): 616-626. http://www.sciencedirect.com/science/article/pii/S2352146517307536 [5] WANG C, YE Z R, YU Y B, et al. Estimation of bus emission models for different fuel types of buses under real conditions[J]. Science of The Total Environment, 2018(640): 965-972. [6] 潘玉瑾, 李媛, 陈军辉, 等. 基于交通流的成都市高分辨率机动车排放清单建立[J]. 环境科学, 2020, 41(8): 3581-3590. https://www.cnki.com.cn/Article/CJFDTOTAL-HJKZ202008017.htmPAN Yujin, LI Yuan, CHEN Junhui, et al. Method for high-resolution emission inventory of road vehicles in Chengdu based on traffic flow monitoring Data[J]. Environmental Science, 2020, 41(8): 3581-3590. (in Chinese) https://www.cnki.com.cn/Article/CJFDTOTAL-HJKZ202008017.htm [7] WEN Y F, ZHANG S J, ZHANG J R, et al. Mapping dynamic road emissions for a megacity by using open-access traffic congestion index data[J]. Applied Energy, 2020(260): 114357. http://www.sciencedirect.com/science/article/pii/S0306261919320446 [8] WU X M, ZHANG S J, WU Y, et al. Real-world emissions and fuel consumption of diesel buses and trucks in Macao: From on-road measurement to policy implications[J]. Atmospheric Environment, 2015(120): 393-403. [9] GUO J D, GE Y S, HAO L J, et al. On-road measurement of regulated pollutants from diesel and CNG buses with urea selective catalytic reduction systems[J]. Atmospheric Environment, 2014(99): 1-9. http://www.sciencedirect.com/science/article/pii/S1352231014005548 [10] PAN Y J, CHEN S Y, QIAO F X, et al. Characteristics analysis and modeling of emissions for bus with liquefied natural gas fuel system in real world driving[J]. Transportation Research Record, 2018, 2672(25): 46-56. doi: 10.1177/0361198118780826 [11] YU Q, LI T Z, LI H. Improving urban bus emission and fuel consumption modeling by incorporating passenger load factor for real world driving[J]. Applied Energy, 2016(161): 101-111. http://www.sciencedirect.com/science/article/pii/S0306261915012222 [12] PAN Y J, CHEN S Y, QIAO F X, et al. Estimation of real-driving emissions for buses fueled with liquefied natural gas based on gradient boosted regression trees[J]. Science of the Total Environment, 2019(660): 741-750. http://www.sciencedirect.com/science/article/pii/S0048969719300609 [13] ALAM A, HATZOPOULOU M. Reducing transit bus emissions: Alternative fuels or traffic operations?[J]. Atmospheric Environment, 2014, 89(2): 129-39. http://www.sciencedirect.com/science/article/pii/S1352231014001393 [14] ALAM A, HATZOPOULOU M. Investigating the isolated and combined effects of congestion, roadway grade, passenger load, and alternative fuels on transit bus emissions[J]. Transportation Research Part D: Transport and Environment, 2014(29): 12-21. http://smartsearch.nstl.gov.cn/paper_detail.html?id=9c8ba515b9b0cbb15613639482925210 [15] SHAN X N, CHEN X H, JIA W J, et al. Evaluating urban bus emission characteristics based on localized moves using sparse GPS data in Shanghai, China[J]. Sustainability, 2019, 11(10): 15. http://www.researchgate.net/publication/333341812_Evaluating_Urban_Bus_Emission_Characteristics_Based_on_Localized_MOVES_Using_Sparse_GPS_Data_in_Shanghai_China [16] YU Q, LI T Z. Evaluation of bus emissions generated near bus stops[J]. Atmospheric Environment, 2014(85): 195-203. http://www.sciencedirect.com/science/article/pii/S1352231013009655 [17] LI J Q, GUPTA S D, ZHANG L P, et al. Evaluate bus emissions generated near far-side and near-side stops and potential reductions by ITS: An empirical study[J]. Transportation Research Part D: Transport and Environment, 2012, 17(1): 73-77. doi: 10.1016/j.trd.2011.09.012 [18] WANG C, SUN Z Q, YE Z R. On-Road bus emission comparison for diverse locations and fuel types in real-world operation conditions[J]. Sustainability, 2020, 12(5): 1798. doi: 10.3390/su12051798 [19] PAN Y J, QIAO F X, TANG K, et al. Understanding and estimating the carbon dioxide emissions for urban buses at different road locations: A comparison between new-energy buses and conventional diesel buses[J]. Science Total Environment, 2020(703): 135533. [20] 杨鹏史, 丁卉, 陈同, 等. 基于局部加权线性回归的城市公交车排放能耗预测[J]. 中山大学学报(自然科学版), 2019, 58(6): 111-118. https://www.cnki.com.cn/Article/CJFDTOTAL-ZSDZ201906015.htmYANG Pengshi, DING Hui, CHEN Tong, et al. Estimation of emissions or electricity consumptions of urban buses based on locally weighted linear regression[J]. Acta Scientiarum Naturalium Universitatis Sunyatseni, 2019, 58(6): 111-118. (in Chinese) https://www.cnki.com.cn/Article/CJFDTOTAL-ZSDZ201906015.htm [21] 陈峻, 王涛, 李春燕, 等. 城市公交车与社会车辆混合流速度模型及交通运行状态分析[J]. 中国公路学报, 2012, 25(1): 128-134+140. doi: 10.3969/j.issn.1001-7372.2012.01.019CHEN Jun, WANG Tao, LI Chunyan, et al. Speed models of mixed traffic flow on bus-car and vehicle and analysis of traffic running state[J]. China Journal of Highway and Transport, 2012, 25(1): 128-134+140. (in Chinese) doi: 10.3969/j.issn.1001-7372.2012.01.019 [22] HE Xiaoyi, ZHANG Shaojun, KE Wenwei, et al. Energy consumption and well-to-wheels air pollutant emissions of battery electric buses under complex operating conditions and implications on fleet electrification[J]. Journal of Cleaner Production, 2018(171): 714-722. http://www.sciencedirect.com/science/article/pii/S0959652617323089 [23] ZHANG Shaojun, WU Ye, HU Jingnan, et al. Can Euro Ⅴ heavy-duty diesel engines, diesel hybrid and alternative fuel technologies mitigate NOx emissions?New evidence from on-road tests of buses in China[J]. Applied Energy, 2014(132): 118-126. http://www.sciencedirect.com/science/article/pii/S0306261914006758 -


 点击查看大图

计量
- 文章访问数: 326
- HTML全文浏览量: 160
- PDF下载量: 14
- 被引次数: 0